Immigrants from Armenia vs Immigrants from Laos Kindergarten

COMPARE

Immigrants from Armenia
Race
Ancestry
AfghanAfricanAlaska NativeAlaskan AthabascanAlbanianAleutAlsatianAmericanApacheArabArapahoArgentineanArmenianAssyrian/Chaldean/SyriacAustralianAustrianBahamianBangladeshiBarbadianBasqueBelgianBelizeanBermudanBhutaneseBlackfeetBolivianBrazilianBritishBritish West IndianBulgarianBurmeseCajunCambodianCanadianCape VerdeanCarpatho RusynCelticCentral AmericanCentral American IndianCherokeeCheyenneChickasawChileanChineseChippewaChoctawColombianColvilleComancheCosta RicanCreeCreekCroatianCrowCubanCypriotCzechCzechoslovakianDanishDelawareDominicanDutchDutch West IndianEastern EuropeanEcuadorianEgyptianEnglishEstonianEthiopianEuropeanFijianFilipinoFinnishFrenchFrench American IndianFrench CanadianGermanGerman RussianGhanaianGreekGuamanian/ChamorroGuatemalanGuyaneseHaitianHmongHonduranHopiHoumaHungarianIcelanderIndian (Asian)IndonesianInupiatIranianIraqiIrishIroquoisIsraeliItalianJamaicanJapaneseJordanianKenyanKiowaKoreanLaotianLatvianLebaneseLiberianLithuanianLumbeeLuxembourgerMacedonianMalaysianMalteseMarshalleseMenomineeMexicanMexican American IndianMongolianMoroccanNative HawaiianNavajoNepaleseNew ZealanderNicaraguanNigerianNorthern EuropeanNorwegianOkinawanOsageOttawaPaiutePakistaniPalestinianPanamanianParaguayanPennsylvania GermanPeruvianPimaPolishPortuguesePotawatomiPuebloPuerto RicanPuget Sound SalishRomanianRussianSalvadoranSamoanScandinavianScotch-IrishScottishSeminoleSenegaleseSerbianShoshoneSierra LeoneanSiouxSlavicSlovakSloveneSomaliSouth AfricanSouth AmericanSouth American IndianSoviet UnionSpaniardSpanishSpanish AmericanSpanish American IndianSri LankanSubsaharan AfricanSudaneseSwedishSwissSyrianTaiwaneseThaiTlingit-HaidaTohono O'OdhamTonganTrinidadian and TobagonianTsimshianTurkishU.S. Virgin IslanderUgandanUkrainianUruguayanUteVenezuelanVietnameseWelshWest IndianYakamaYaquiYugoslavianYumanYup'ikZimbabwean
Immigration
NonimmigrantsImmigrantsAfghanistanAfricaAlbaniaArgentinaArmeniaAsiaAustraliaAustriaBahamasBangladeshBarbadosBelarusBelgiumBelizeBoliviaBosnia and HerzegovinaBrazilBulgariaBurma/MyanmarCabo VerdeCambodiaCameroonCanadaCaribbeanCentral AmericaChileChinaColombiaCongoCosta RicaCroatiaCubaCzechoslovakiaDenmarkDominicaDominican RepublicEastern AfricaEastern AsiaEastern EuropeEcuadorEgyptEl SalvadorEnglandEritreaEthiopiaEuropeFijiFranceGermanyGhanaGreeceGrenadaGuatemalaGuyanaHaitiHondurasHong KongHungaryIndiaIndonesiaIranIraqIrelandIsraelItalyJamaicaJapanJordanKazakhstanKenyaKoreaKuwaitLatin AmericaLatviaLebanonLiberiaLithuaniaMalaysiaMexicoMicronesiaMiddle AfricaMoldovaMoroccoNepalNetherlandsNicaraguaNigeriaNorth AmericaNorth MacedoniaNorthern AfricaNorthern EuropeNorwayOceaniaPakistanPanamaPeruPhilippinesPolandPortugalRomaniaRussiaSaudi ArabiaScotlandSenegalSerbiaSierra LeoneSingaporeSomaliaSouth AfricaSouth AmericaSouth Central AsiaSouth Eastern AsiaSouthern EuropeSpainSri LankaSt. Vincent and the GrenadinesSudanSwedenSwitzerlandSyriaTaiwanThailandTrinidad and TobagoTurkeyUgandaUkraineUruguayUzbekistanVenezuelaVietnamWest IndiesWestern AfricaWestern AsiaWestern EuropeYemenZaireZimbabweAzores
Immigrants from Laos
Race
Ancestry
AfghanAfricanAlaska NativeAlaskan AthabascanAlbanianAleutAlsatianAmericanApacheArabArapahoArgentineanArmenianAssyrian/Chaldean/SyriacAustralianAustrianBahamianBangladeshiBarbadianBasqueBelgianBelizeanBermudanBhutaneseBlackfeetBolivianBrazilianBritishBritish West IndianBulgarianBurmeseCajunCambodianCanadianCape VerdeanCarpatho RusynCelticCentral AmericanCentral American IndianCherokeeCheyenneChickasawChileanChineseChippewaChoctawColombianColvilleComancheCosta RicanCreeCreekCroatianCrowCubanCypriotCzechCzechoslovakianDanishDelawareDominicanDutchDutch West IndianEastern EuropeanEcuadorianEgyptianEnglishEstonianEthiopianEuropeanFijianFilipinoFinnishFrenchFrench American IndianFrench CanadianGermanGerman RussianGhanaianGreekGuamanian/ChamorroGuatemalanGuyaneseHaitianHmongHonduranHopiHoumaHungarianIcelanderIndian (Asian)IndonesianInupiatIranianIraqiIrishIroquoisIsraeliItalianJamaicanJapaneseJordanianKenyanKiowaKoreanLaotianLatvianLebaneseLiberianLithuanianLumbeeLuxembourgerMacedonianMalaysianMalteseMarshalleseMenomineeMexicanMexican American IndianMongolianMoroccanNative HawaiianNavajoNepaleseNew ZealanderNicaraguanNigerianNorthern EuropeanNorwegianOkinawanOsageOttawaPaiutePakistaniPalestinianPanamanianParaguayanPennsylvania GermanPeruvianPimaPolishPortuguesePotawatomiPuebloPuerto RicanPuget Sound SalishRomanianRussianSalvadoranSamoanScandinavianScotch-IrishScottishSeminoleSenegaleseSerbianShoshoneSierra LeoneanSiouxSlavicSlovakSloveneSomaliSouth AfricanSouth AmericanSouth American IndianSoviet UnionSpaniardSpanishSpanish AmericanSpanish American IndianSri LankanSubsaharan AfricanSudaneseSwedishSwissSyrianTaiwaneseThaiTlingit-HaidaTohono O'OdhamTonganTrinidadian and TobagonianTsimshianTurkishU.S. Virgin IslanderUgandanUkrainianUruguayanUteVenezuelanVietnameseWelshWest IndianYakamaYaquiYugoslavianYumanYup'ikZimbabwean
Immigration
NonimmigrantsImmigrantsAfghanistanAfricaAlbaniaArgentinaAsiaAustraliaAustriaBahamasBangladeshBarbadosBelarusBelgiumBelizeBoliviaBosnia and HerzegovinaBrazilBulgariaBurma/MyanmarCabo VerdeCambodiaCameroonCanadaCaribbeanCentral AmericaChileChinaColombiaCongoCosta RicaCroatiaCubaCzechoslovakiaDenmarkDominicaDominican RepublicEastern AfricaEastern AsiaEastern EuropeEcuadorEgyptEl SalvadorEnglandEritreaEthiopiaEuropeFijiFranceGermanyGhanaGreeceGrenadaGuatemalaGuyanaHaitiHondurasHong KongHungaryIndiaIndonesiaIranIraqIrelandIsraelItalyJamaicaJapanJordanKazakhstanKenyaKoreaKuwaitLaosLatin AmericaLatviaLebanonLiberiaLithuaniaMalaysiaMexicoMicronesiaMiddle AfricaMoldovaMoroccoNepalNetherlandsNicaraguaNigeriaNorth AmericaNorth MacedoniaNorthern AfricaNorthern EuropeNorwayOceaniaPakistanPanamaPeruPhilippinesPolandPortugalRomaniaRussiaSaudi ArabiaScotlandSenegalSerbiaSierra LeoneSingaporeSomaliaSouth AfricaSouth AmericaSouth Central AsiaSouth Eastern AsiaSouthern EuropeSpainSri LankaSt. Vincent and the GrenadinesSudanSwedenSwitzerlandSyriaTaiwanThailandTrinidad and TobagoTurkeyUgandaUkraineUruguayUzbekistanVenezuelaVietnamWest IndiesWestern AfricaWestern AsiaWestern EuropeYemenZaireZimbabweAzores
Kindergarten
Income
Poverty
Unemployment
Labor Participation
Family Structure
Vehicle Availability
Education Level
Disability

Kindergarten Comparison

Immigrants from Armenia

Immigrants from Laos

Tragic
Tragic
96.6%
KINDERGARTEN
0.0/ 100
METRIC RATING
331st/ 347
METRIC RANK
96.9%
KINDERGARTEN
0.0/ 100
METRIC RATING
318th/ 347
METRIC RANK

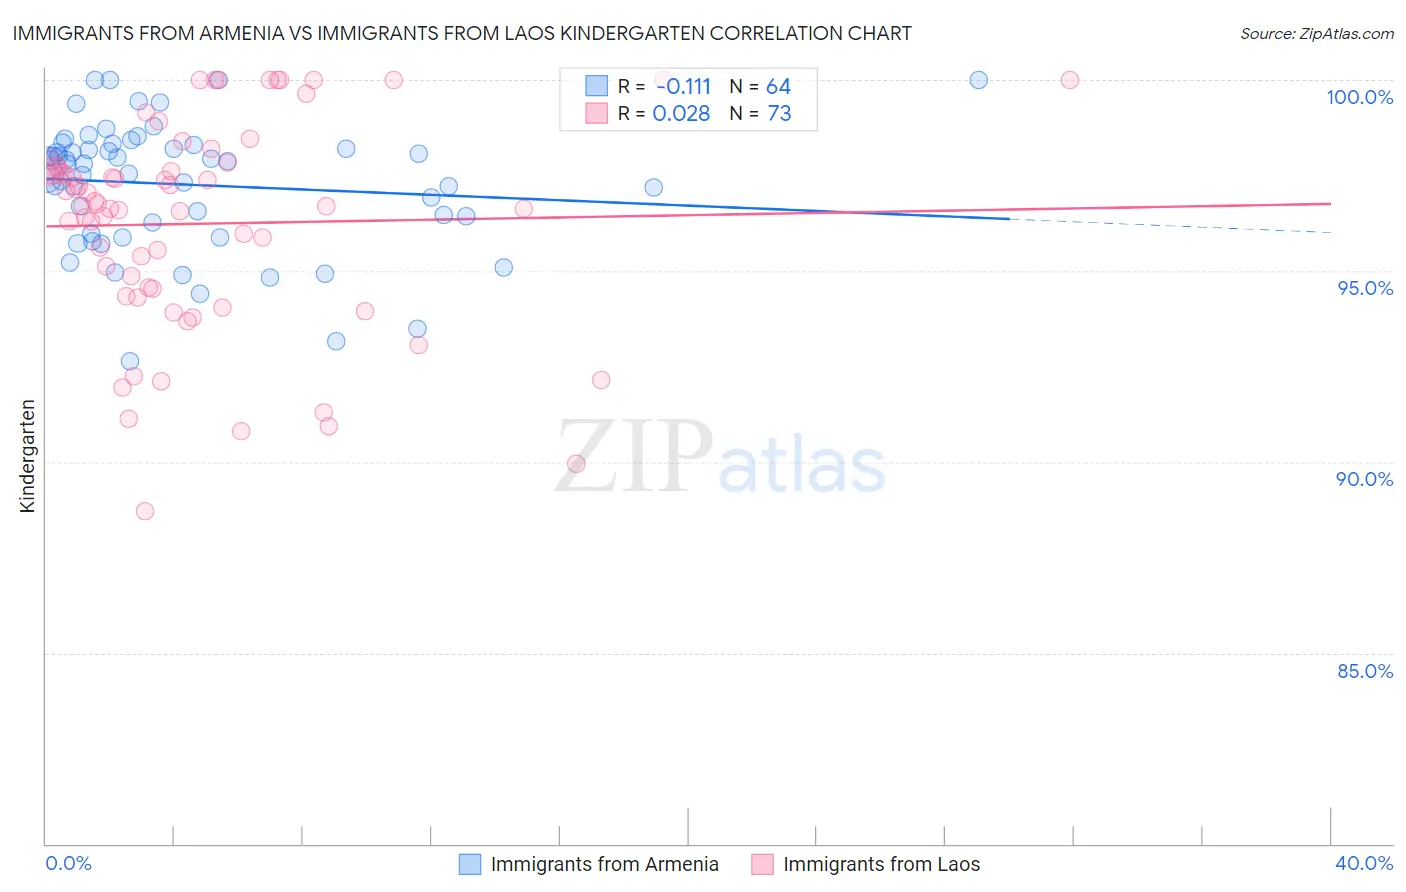
Immigrants from Armenia vs Immigrants from Laos Kindergarten Correlation Chart

The statistical analysis conducted on geographies consisting of 97,725,276 people shows a poor negative correlation between the proportion of Immigrants from Armenia and percentage of population with at least kindergarten education in the United States with a correlation coefficient (R) of -0.111 and weighted average of 96.6%. Similarly, the statistical analysis conducted on geographies consisting of 201,453,273 people shows no correlation between the proportion of Immigrants from Laos and percentage of population with at least kindergarten education in the United States with a correlation coefficient (R) of 0.028 and weighted average of 96.9%, a difference of 0.23%.
Immigrants from Armenia vs Immigrants from Laos Kindergarten

Kindergarten Correlation Summary

MeasurementImmigrants from ArmeniaImmigrants from Laos
Minimum92.6%88.7%
Maximum100.0%100.0%
Range7.4%11.3%
Mean97.3%96.2%
Median97.8%96.7%
Interquartile 25% (IQ1)96.1%94.4%
Interquartile 75% (IQ3)98.2%97.7%
Interquartile Range (IQR)2.1%3.3%
Standard Deviation (Sample)1.7%2.7%
Standard Deviation (Population)1.7%2.7%

Demographics Similar to Immigrants from Armenia and Immigrants from Laos by Kindergarten

In terms of kindergarten, the demographic groups most similar to Immigrants from Armenia are Yakama (96.6%, a difference of 0.020%), Immigrants from Vietnam (96.7%, a difference of 0.030%), Japanese (96.7%, a difference of 0.030%), Central American (96.6%, a difference of 0.040%), and Immigrants from Dominican Republic (96.6%, a difference of 0.060%). Similarly, the demographic groups most similar to Immigrants from Laos are Immigrants from Guyana (96.8%, a difference of 0.010%), Immigrants from Burma/Myanmar (96.8%, a difference of 0.010%), Immigrants from Bangladesh (96.8%, a difference of 0.020%), Mexican American Indian (96.8%, a difference of 0.030%), and Immigrants from Honduras (96.8%, a difference of 0.040%).
DemographicsRating | RankKindergarten
Hondurans
0.0
/100
|
#314
Tragic
96.9%
Immigrants | Belize
0.0
/100
|
#315
Tragic
96.9%
Immigrants | Nicaragua
0.0
/100
|
#316
Tragic
96.9%
Immigrants | Ecuador
0.0
/100
|
#317
Tragic
96.9%
Immigrants | Laos
0.0
/100
|
#318
Tragic
96.9%
Immigrants | Guyana
0.0
/100
|
#319
Tragic
96.8%
Immigrants | Burma/Myanmar
0.0
/100
|
#320
Tragic
96.8%
Immigrants | Bangladesh
0.0
/100
|
#321
Tragic
96.8%
Mexican American Indians
0.0
/100
|
#322
Tragic
96.8%
Immigrants | Honduras
0.0
/100
|
#323
Tragic
96.8%
Vietnamese
0.0
/100
|
#324
Tragic
96.8%
Indonesians
0.0
/100
|
#325
Tragic
96.8%
Dominicans
0.0
/100
|
#326
Tragic
96.8%
Mexicans
0.0
/100
|
#327
Tragic
96.7%
Immigrants | Latin America
0.0
/100
|
#328
Tragic
96.7%
Immigrants | Vietnam
0.0
/100
|
#329
Tragic
96.7%
Japanese
0.0
/100
|
#330
Tragic
96.7%
Immigrants | Armenia
0.0
/100
|
#331
Tragic
96.6%
Yakama
0.0
/100
|
#332
Tragic
96.6%
Central Americans
0.0
/100
|
#333
Tragic
96.6%
Immigrants | Dominican Republic
0.0
/100
|
#334
Tragic
96.6%