Immigrants from Argentina vs Welsh 9th Grade
COMPARE
Immigrants from Argentina
Welsh
9th Grade
9th Grade Comparison
Immigrants from Argentina
Welsh
94.8%
9TH GRADE
34.4/ 100
METRIC RATING
189th/ 347
METRIC RANK
96.4%
9TH GRADE
100.0/ 100
METRIC RATING
19th/ 347
METRIC RANK
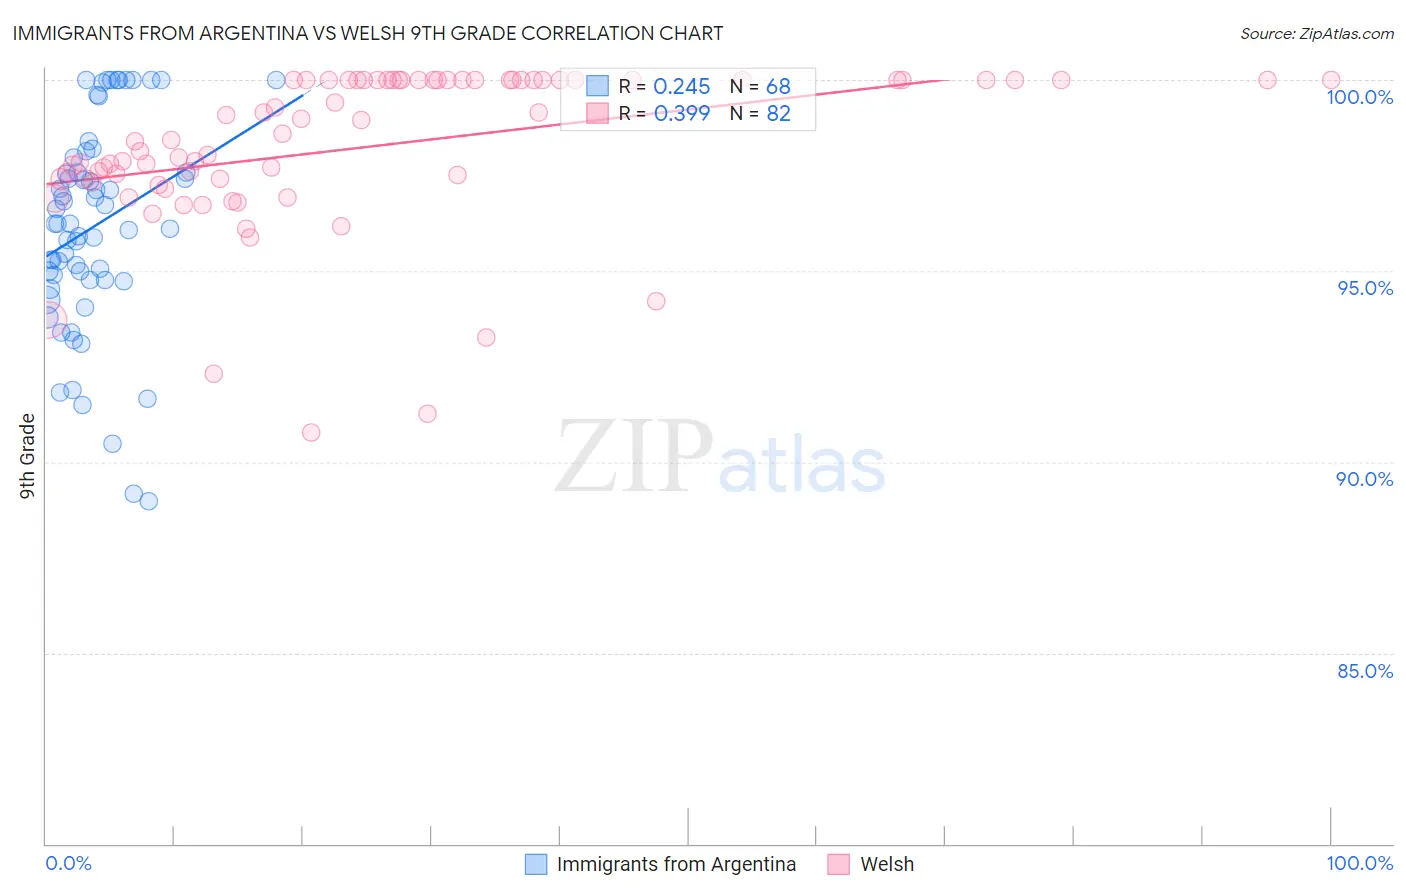
Immigrants from Argentina vs Welsh 9th Grade Correlation Chart
The statistical analysis conducted on geographies consisting of 264,436,618 people shows a weak positive correlation between the proportion of Immigrants from Argentina and percentage of population with at least 9th grade education in the United States with a correlation coefficient (R) of 0.245 and weighted average of 94.8%. Similarly, the statistical analysis conducted on geographies consisting of 528,596,253 people shows a mild positive correlation between the proportion of Welsh and percentage of population with at least 9th grade education in the United States with a correlation coefficient (R) of 0.399 and weighted average of 96.4%, a difference of 1.8%.
9th Grade Correlation Summary
| Measurement | Immigrants from Argentina | Welsh |
| Minimum | 89.0% | 90.8% |
| Maximum | 100.0% | 100.0% |
| Range | 11.0% | 9.2% |
| Mean | 96.2% | 98.2% |
| Median | 96.2% | 98.5% |
| Interquartile 25% (IQ1) | 94.8% | 97.4% |
| Interquartile 75% (IQ3) | 97.8% | 100.0% |
| Interquartile Range (IQR) | 3.0% | 2.6% |
| Standard Deviation (Sample) | 2.7% | 2.1% |
| Standard Deviation (Population) | 2.7% | 2.1% |
Similar Demographics by 9th Grade
Demographics Similar to Immigrants from Argentina by 9th Grade
In terms of 9th grade, the demographic groups most similar to Immigrants from Argentina are Immigrants from Albania (94.8%, a difference of 0.0%), Guamanian/Chamorro (94.8%, a difference of 0.010%), Sudanese (94.7%, a difference of 0.010%), Liberian (94.8%, a difference of 0.020%), and Hopi (94.8%, a difference of 0.020%).
| Demographics | Rating | Rank | 9th Grade |
| Seminole | 42.5 /100 | #182 | Average 94.8% |
| Immigrants | Nepal | 39.7 /100 | #183 | Fair 94.8% |
| Argentineans | 37.6 /100 | #184 | Fair 94.8% |
| Liberians | 37.4 /100 | #185 | Fair 94.8% |
| Hopi | 37.1 /100 | #186 | Fair 94.8% |
| Guamanians/Chamorros | 35.5 /100 | #187 | Fair 94.8% |
| Immigrants | Albania | 34.5 /100 | #188 | Fair 94.8% |
| Immigrants | Argentina | 34.4 /100 | #189 | Fair 94.8% |
| Sudanese | 32.7 /100 | #190 | Fair 94.7% |
| Assyrians/Chaldeans/Syriacs | 32.0 /100 | #191 | Fair 94.7% |
| Immigrants | Northern Africa | 30.7 /100 | #192 | Fair 94.7% |
| Paraguayans | 30.1 /100 | #193 | Fair 94.7% |
| Panamanians | 29.0 /100 | #194 | Fair 94.7% |
| Marshallese | 27.9 /100 | #195 | Fair 94.7% |
| Immigrants | Lebanon | 27.2 /100 | #196 | Fair 94.7% |
Demographics Similar to Welsh by 9th Grade
In terms of 9th grade, the demographic groups most similar to Welsh are Italian (96.4%, a difference of 0.0%), Alaskan Athabascan (96.4%, a difference of 0.020%), European (96.4%, a difference of 0.030%), Scandinavian (96.5%, a difference of 0.040%), and Czech (96.4%, a difference of 0.040%).
| Demographics | Rating | Rank | 9th Grade |
| English | 100.0 /100 | #12 | Exceptional 96.6% |
| Danes | 100.0 /100 | #13 | Exceptional 96.5% |
| Scottish | 100.0 /100 | #14 | Exceptional 96.5% |
| Irish | 100.0 /100 | #15 | Exceptional 96.5% |
| Croatians | 100.0 /100 | #16 | Exceptional 96.5% |
| Dutch | 100.0 /100 | #17 | Exceptional 96.5% |
| Scandinavians | 100.0 /100 | #18 | Exceptional 96.5% |
| Welsh | 100.0 /100 | #19 | Exceptional 96.4% |
| Italians | 100.0 /100 | #20 | Exceptional 96.4% |
| Alaskan Athabascans | 100.0 /100 | #21 | Exceptional 96.4% |
| Europeans | 100.0 /100 | #22 | Exceptional 96.4% |
| Czechs | 100.0 /100 | #23 | Exceptional 96.4% |
| Latvians | 100.0 /100 | #24 | Exceptional 96.4% |
| French | 100.0 /100 | #25 | Exceptional 96.3% |
| French Canadians | 100.0 /100 | #26 | Exceptional 96.3% |