Immigrants from Argentina vs Ukrainian 3rd Grade
COMPARE
Immigrants from Argentina
Ukrainian
3rd Grade
3rd Grade Comparison
Immigrants from Argentina
Ukrainians
97.7%
3RD GRADE
37.0/ 100
METRIC RATING
185th/ 347
METRIC RANK
98.1%
3RD GRADE
98.9/ 100
METRIC RATING
83rd/ 347
METRIC RANK
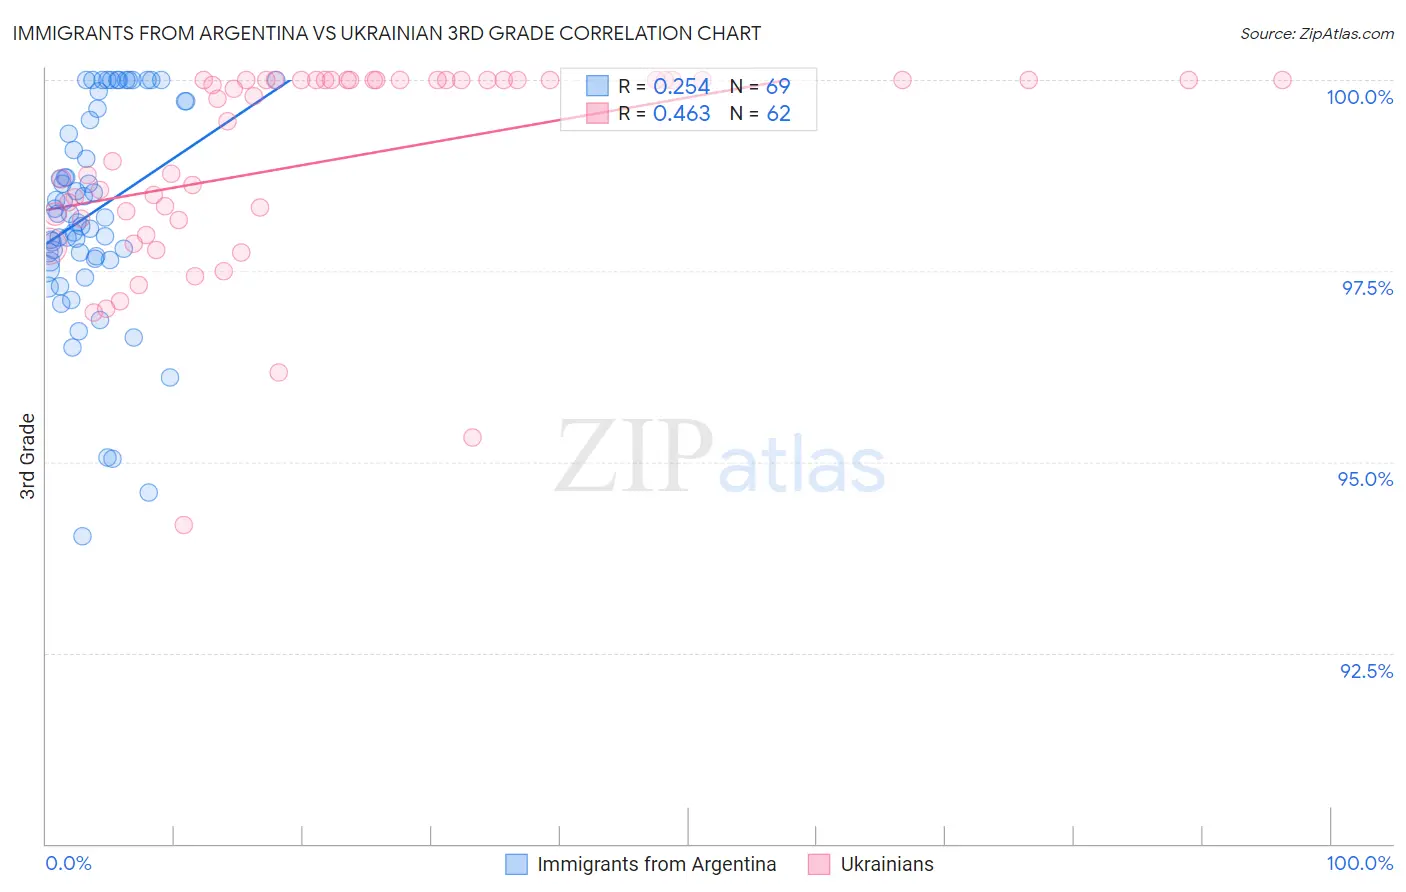
Immigrants from Argentina vs Ukrainian 3rd Grade Correlation Chart
The statistical analysis conducted on geographies consisting of 264,437,906 people shows a weak positive correlation between the proportion of Immigrants from Argentina and percentage of population with at least 3rd grade education in the United States with a correlation coefficient (R) of 0.254 and weighted average of 97.7%. Similarly, the statistical analysis conducted on geographies consisting of 448,698,169 people shows a moderate positive correlation between the proportion of Ukrainians and percentage of population with at least 3rd grade education in the United States with a correlation coefficient (R) of 0.463 and weighted average of 98.1%, a difference of 0.43%.
3rd Grade Correlation Summary
| Measurement | Immigrants from Argentina | Ukrainian |
| Minimum | 94.0% | 94.2% |
| Maximum | 100.0% | 100.0% |
| Range | 6.0% | 5.8% |
| Mean | 98.3% | 98.9% |
| Median | 98.2% | 99.8% |
| Interquartile 25% (IQ1) | 97.6% | 98.2% |
| Interquartile 75% (IQ3) | 99.7% | 100.0% |
| Interquartile Range (IQR) | 2.0% | 1.8% |
| Standard Deviation (Sample) | 1.4% | 1.3% |
| Standard Deviation (Population) | 1.4% | 1.3% |
Similar Demographics by 3rd Grade
Demographics Similar to Immigrants from Argentina by 3rd Grade
In terms of 3rd grade, the demographic groups most similar to Immigrants from Argentina are Immigrants from Kazakhstan (97.7%, a difference of 0.0%), Portuguese (97.7%, a difference of 0.0%), Arab (97.7%, a difference of 0.010%), Native/Alaskan (97.7%, a difference of 0.010%), and Immigrants from Taiwan (97.7%, a difference of 0.010%).
| Demographics | Rating | Rank | 3rd Grade |
| Immigrants | Brazil | 46.4 /100 | #178 | Average 97.7% |
| Immigrants | Belarus | 45.9 /100 | #179 | Average 97.7% |
| Immigrants | Sri Lanka | 45.1 /100 | #180 | Average 97.7% |
| Immigrants | Venezuela | 44.4 /100 | #181 | Average 97.7% |
| Argentineans | 42.9 /100 | #182 | Average 97.7% |
| Arabs | 40.0 /100 | #183 | Fair 97.7% |
| Immigrants | Kazakhstan | 37.4 /100 | #184 | Fair 97.7% |
| Immigrants | Argentina | 37.0 /100 | #185 | Fair 97.7% |
| Portuguese | 36.2 /100 | #186 | Fair 97.7% |
| Natives/Alaskans | 35.2 /100 | #187 | Fair 97.7% |
| Immigrants | Taiwan | 34.2 /100 | #188 | Fair 97.7% |
| Pakistanis | 34.2 /100 | #189 | Fair 97.7% |
| Panamanians | 31.5 /100 | #190 | Fair 97.7% |
| Blacks/African Americans | 29.6 /100 | #191 | Fair 97.7% |
| Mongolians | 29.1 /100 | #192 | Fair 97.7% |
Demographics Similar to Ukrainians by 3rd Grade
In terms of 3rd grade, the demographic groups most similar to Ukrainians are Immigrants from Sweden (98.1%, a difference of 0.0%), Immigrants from Belgium (98.1%, a difference of 0.010%), Macedonian (98.1%, a difference of 0.010%), Icelander (98.1%, a difference of 0.010%), and Shoshone (98.1%, a difference of 0.010%).
| Demographics | Rating | Rank | 3rd Grade |
| Immigrants | England | 99.2 /100 | #76 | Exceptional 98.2% |
| Immigrants | Lithuania | 99.2 /100 | #77 | Exceptional 98.2% |
| Osage | 99.2 /100 | #78 | Exceptional 98.2% |
| Immigrants | Belgium | 99.1 /100 | #79 | Exceptional 98.1% |
| Macedonians | 99.1 /100 | #80 | Exceptional 98.1% |
| Icelanders | 99.1 /100 | #81 | Exceptional 98.1% |
| Shoshone | 99.0 /100 | #82 | Exceptional 98.1% |
| Ukrainians | 98.9 /100 | #83 | Exceptional 98.1% |
| Immigrants | Sweden | 98.9 /100 | #84 | Exceptional 98.1% |
| Immigrants | Australia | 98.9 /100 | #85 | Exceptional 98.1% |
| Potawatomi | 98.9 /100 | #86 | Exceptional 98.1% |
| Immigrants | Denmark | 98.8 /100 | #87 | Exceptional 98.1% |
| Immigrants | India | 98.8 /100 | #88 | Exceptional 98.1% |
| Delaware | 98.8 /100 | #89 | Exceptional 98.1% |
| Zimbabweans | 98.8 /100 | #90 | Exceptional 98.1% |