Immigrants from Africa vs Greek Associate's Degree
COMPARE
Immigrants from Africa
Greek
Associate's Degree
Associate's Degree Comparison
Immigrants from Africa
Greeks
46.8%
ASSOCIATE'S DEGREE
63.2/ 100
METRIC RATING
162nd/ 347
METRIC RANK
50.3%
ASSOCIATE'S DEGREE
98.9/ 100
METRIC RATING
82nd/ 347
METRIC RANK
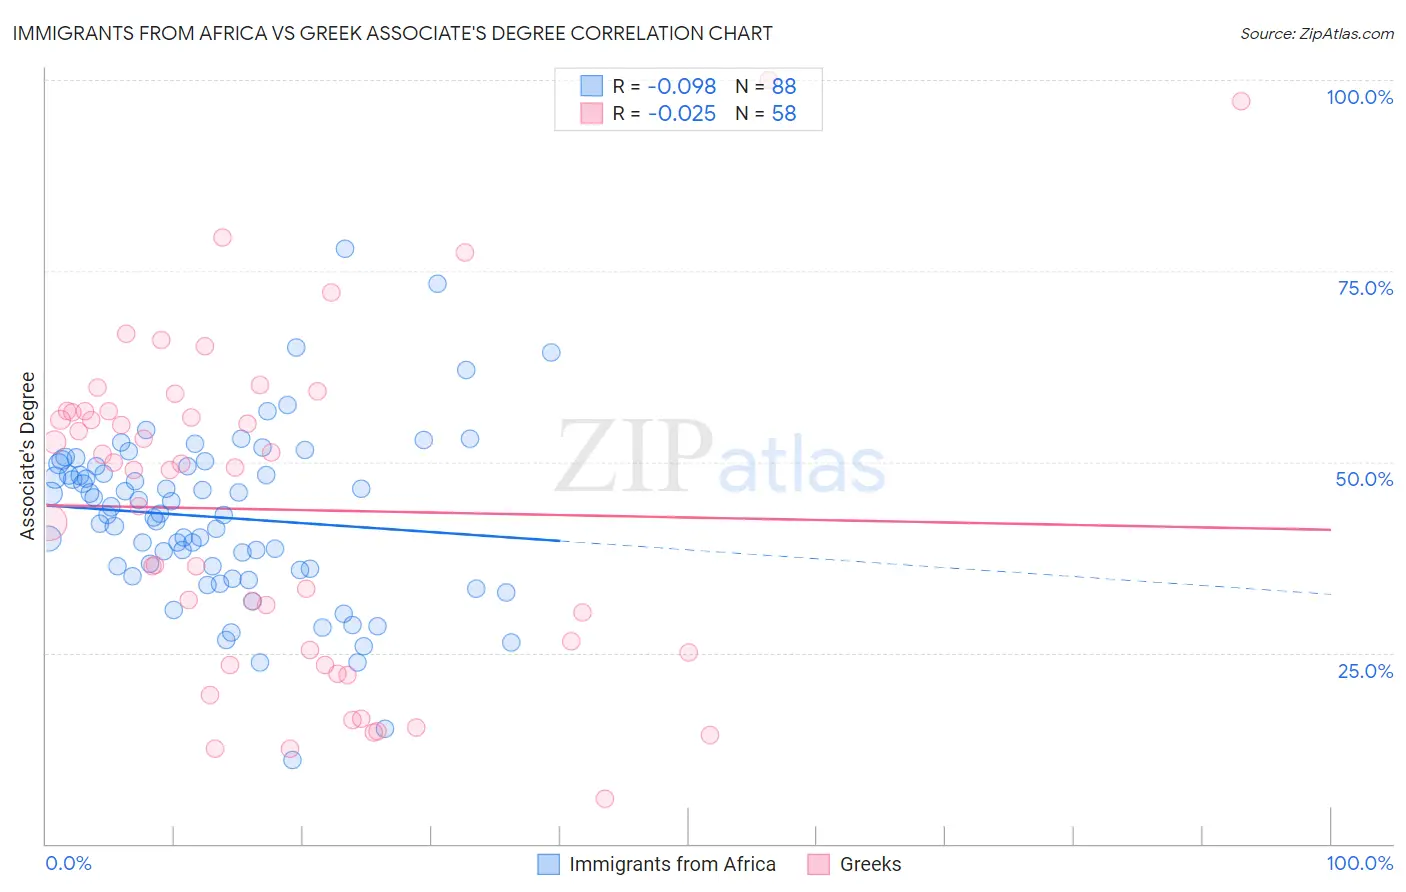
Immigrants from Africa vs Greek Associate's Degree Correlation Chart
The statistical analysis conducted on geographies consisting of 469,405,809 people shows a slight negative correlation between the proportion of Immigrants from Africa and percentage of population with at least associate's degree education in the United States with a correlation coefficient (R) of -0.098 and weighted average of 46.8%. Similarly, the statistical analysis conducted on geographies consisting of 482,724,257 people shows no correlation between the proportion of Greeks and percentage of population with at least associate's degree education in the United States with a correlation coefficient (R) of -0.025 and weighted average of 50.3%, a difference of 7.4%.
Associate's Degree Correlation Summary
| Measurement | Immigrants from Africa | Greek |
| Minimum | 11.0% | 5.9% |
| Maximum | 78.0% | 100.0% |
| Range | 67.0% | 94.1% |
| Mean | 42.7% | 43.8% |
| Median | 43.2% | 49.2% |
| Interquartile 25% (IQ1) | 35.9% | 25.0% |
| Interquartile 75% (IQ3) | 49.4% | 56.6% |
| Interquartile Range (IQR) | 13.5% | 31.6% |
| Standard Deviation (Sample) | 11.2% | 21.4% |
| Standard Deviation (Population) | 11.2% | 21.2% |
Similar Demographics by Associate's Degree
Demographics Similar to Immigrants from Africa by Associate's Degree
In terms of associate's degree, the demographic groups most similar to Immigrants from Africa are Somali (46.8%, a difference of 0.060%), Colombian (46.8%, a difference of 0.060%), Scandinavian (46.9%, a difference of 0.16%), Scottish (46.9%, a difference of 0.18%), and Immigrants from South America (46.7%, a difference of 0.26%).
| Demographics | Rating | Rank | Associate's Degree |
| Kenyans | 70.6 /100 | #155 | Good 47.1% |
| South Americans | 70.5 /100 | #156 | Good 47.1% |
| Sudanese | 70.3 /100 | #157 | Good 47.1% |
| Immigrants | Germany | 69.7 /100 | #158 | Good 47.1% |
| Immigrants | Poland | 69.2 /100 | #159 | Good 47.1% |
| Scottish | 65.4 /100 | #160 | Good 46.9% |
| Scandinavians | 65.2 /100 | #161 | Good 46.9% |
| Immigrants | Africa | 63.2 /100 | #162 | Good 46.8% |
| Somalis | 62.5 /100 | #163 | Good 46.8% |
| Colombians | 62.4 /100 | #164 | Good 46.8% |
| Immigrants | South America | 59.9 /100 | #165 | Average 46.7% |
| Hungarians | 59.3 /100 | #166 | Average 46.7% |
| Immigrants | Sierra Leone | 59.2 /100 | #167 | Average 46.7% |
| Immigrants | Somalia | 55.5 /100 | #168 | Average 46.5% |
| Uruguayans | 55.4 /100 | #169 | Average 46.5% |
Demographics Similar to Greeks by Associate's Degree
In terms of associate's degree, the demographic groups most similar to Greeks are Immigrants from Uzbekistan (50.3%, a difference of 0.040%), Immigrants from Hungary (50.2%, a difference of 0.060%), Immigrants from Egypt (50.2%, a difference of 0.11%), Immigrants from Croatia (50.2%, a difference of 0.12%), and Maltese (50.4%, a difference of 0.23%).
| Demographics | Rating | Rank | Associate's Degree |
| Immigrants | Scotland | 99.3 /100 | #75 | Exceptional 50.6% |
| Immigrants | Zimbabwe | 99.2 /100 | #76 | Exceptional 50.5% |
| Immigrants | Lebanon | 99.1 /100 | #77 | Exceptional 50.5% |
| Immigrants | Eastern Europe | 99.1 /100 | #78 | Exceptional 50.5% |
| Ethiopians | 99.1 /100 | #79 | Exceptional 50.4% |
| Armenians | 99.1 /100 | #80 | Exceptional 50.4% |
| Maltese | 99.1 /100 | #81 | Exceptional 50.4% |
| Greeks | 98.9 /100 | #82 | Exceptional 50.3% |
| Immigrants | Uzbekistan | 98.9 /100 | #83 | Exceptional 50.3% |
| Immigrants | Hungary | 98.9 /100 | #84 | Exceptional 50.2% |
| Immigrants | Egypt | 98.9 /100 | #85 | Exceptional 50.2% |
| Immigrants | Croatia | 98.9 /100 | #86 | Exceptional 50.2% |
| Immigrants | Moldova | 98.8 /100 | #87 | Exceptional 50.2% |
| Immigrants | Canada | 98.7 /100 | #88 | Exceptional 50.1% |
| Immigrants | Western Europe | 98.7 /100 | #89 | Exceptional 50.1% |