Immigrants from Afghanistan vs Senegalese 10th Grade
COMPARE
Immigrants from Afghanistan
Senegalese
10th Grade
10th Grade Comparison
Immigrants from Afghanistan
Senegalese
92.8%
10TH GRADE
1.4/ 100
METRIC RATING
247th/ 347
METRIC RANK
93.0%
10TH GRADE
2.4/ 100
METRIC RATING
243rd/ 347
METRIC RANK
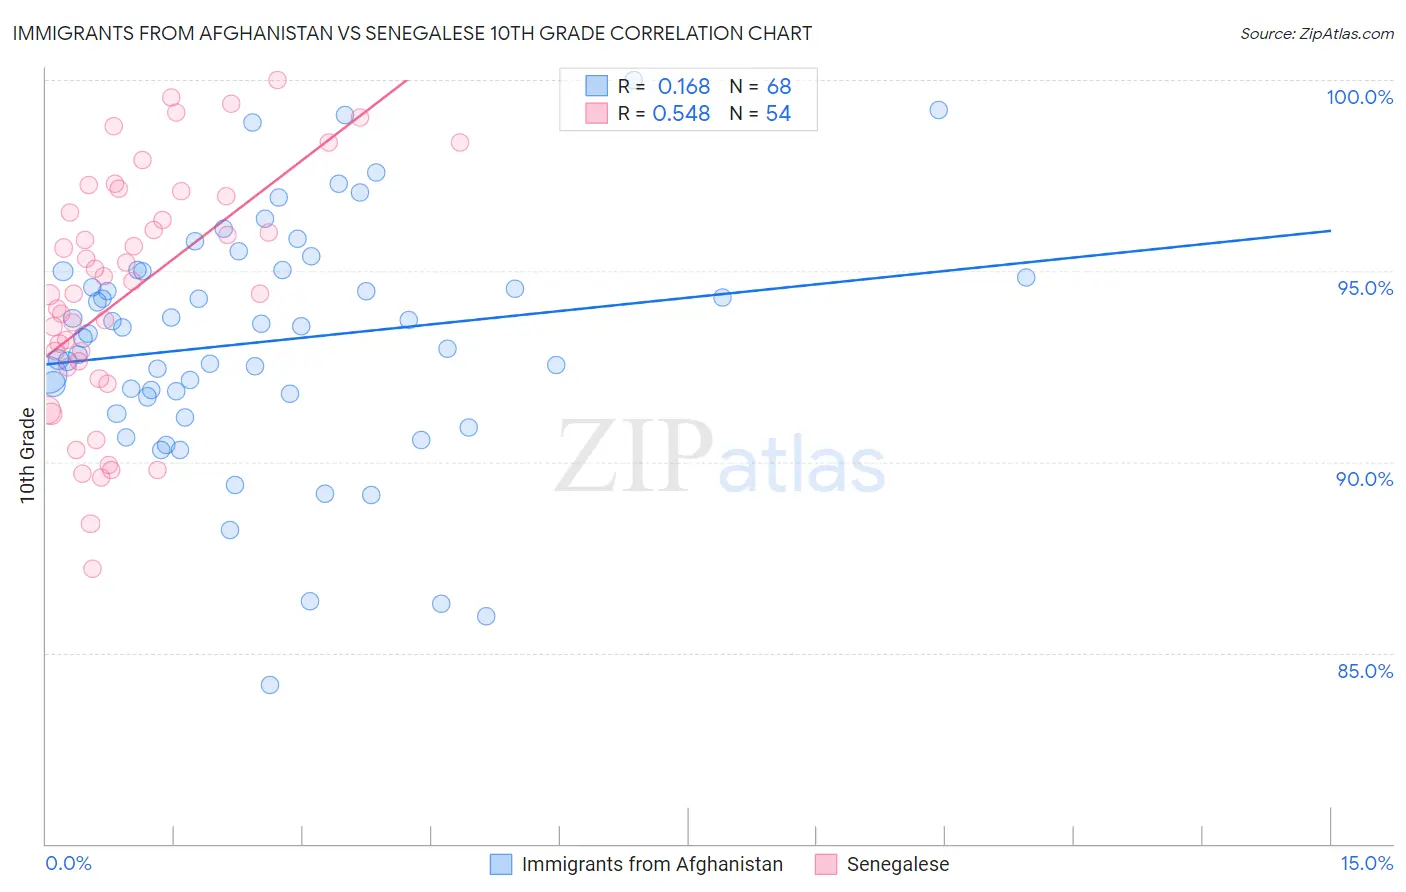
Immigrants from Afghanistan vs Senegalese 10th Grade Correlation Chart
The statistical analysis conducted on geographies consisting of 147,629,924 people shows a poor positive correlation between the proportion of Immigrants from Afghanistan and percentage of population with at least 10th grade education in the United States with a correlation coefficient (R) of 0.168 and weighted average of 92.8%. Similarly, the statistical analysis conducted on geographies consisting of 78,142,569 people shows a substantial positive correlation between the proportion of Senegalese and percentage of population with at least 10th grade education in the United States with a correlation coefficient (R) of 0.548 and weighted average of 93.0%, a difference of 0.12%.
10th Grade Correlation Summary
| Measurement | Immigrants from Afghanistan | Senegalese |
| Minimum | 84.2% | 87.2% |
| Maximum | 100.0% | 100.0% |
| Range | 15.8% | 12.8% |
| Mean | 93.2% | 94.5% |
| Median | 93.4% | 94.6% |
| Interquartile 25% (IQ1) | 91.7% | 92.5% |
| Interquartile 75% (IQ3) | 95.0% | 96.9% |
| Interquartile Range (IQR) | 3.3% | 4.5% |
| Standard Deviation (Sample) | 3.1% | 3.1% |
| Standard Deviation (Population) | 3.1% | 3.1% |
Demographics Similar to Immigrants from Afghanistan and Senegalese by 10th Grade
In terms of 10th grade, the demographic groups most similar to Immigrants from Afghanistan are Colombian (92.8%, a difference of 0.010%), Immigrants from Senegal (92.8%, a difference of 0.010%), Immigrants from Middle Africa (92.9%, a difference of 0.040%), Jamaican (92.8%, a difference of 0.040%), and Uruguayan (92.9%, a difference of 0.060%). Similarly, the demographic groups most similar to Senegalese are Immigrants from Cameroon (93.0%, a difference of 0.020%), Immigrants from Somalia (93.0%, a difference of 0.030%), Spanish American (92.9%, a difference of 0.030%), Uruguayan (92.9%, a difference of 0.060%), and Immigrants from Middle Africa (92.9%, a difference of 0.080%).
| Demographics | Rating | Rank | 10th Grade |
| Africans | 4.6 /100 | #235 | Tragic 93.1% |
| Afghans | 4.5 /100 | #236 | Tragic 93.1% |
| Immigrants | Panama | 4.3 /100 | #237 | Tragic 93.1% |
| Nigerians | 4.2 /100 | #238 | Tragic 93.1% |
| Costa Ricans | 4.2 /100 | #239 | Tragic 93.1% |
| Immigrants | Hong Kong | 4.2 /100 | #240 | Tragic 93.1% |
| Immigrants | Somalia | 2.7 /100 | #241 | Tragic 93.0% |
| Immigrants | Cameroon | 2.6 /100 | #242 | Tragic 93.0% |
| Senegalese | 2.4 /100 | #243 | Tragic 93.0% |
| Spanish Americans | 2.1 /100 | #244 | Tragic 92.9% |
| Uruguayans | 1.8 /100 | #245 | Tragic 92.9% |
| Immigrants | Middle Africa | 1.7 /100 | #246 | Tragic 92.9% |
| Immigrants | Afghanistan | 1.4 /100 | #247 | Tragic 92.8% |
| Colombians | 1.4 /100 | #248 | Tragic 92.8% |
| Immigrants | Senegal | 1.4 /100 | #249 | Tragic 92.8% |
| Jamaicans | 1.2 /100 | #250 | Tragic 92.8% |
| Immigrants | Thailand | 1.0 /100 | #251 | Tragic 92.8% |
| South Americans | 0.9 /100 | #252 | Tragic 92.8% |
| Ghanaians | 0.9 /100 | #253 | Tragic 92.8% |
| Armenians | 0.9 /100 | #254 | Tragic 92.7% |
| Immigrants | Bolivia | 0.7 /100 | #255 | Tragic 92.7% |