Immigrants from Afghanistan vs Pima Doctorate Degree
COMPARE
Immigrants from Afghanistan
Pima
Doctorate Degree
Doctorate Degree Comparison
Immigrants from Afghanistan
Pima
1.8%
DOCTORATE DEGREE
44.3/ 100
METRIC RATING
182nd/ 347
METRIC RANK
1.3%
DOCTORATE DEGREE
0.0/ 100
METRIC RATING
325th/ 347
METRIC RANK
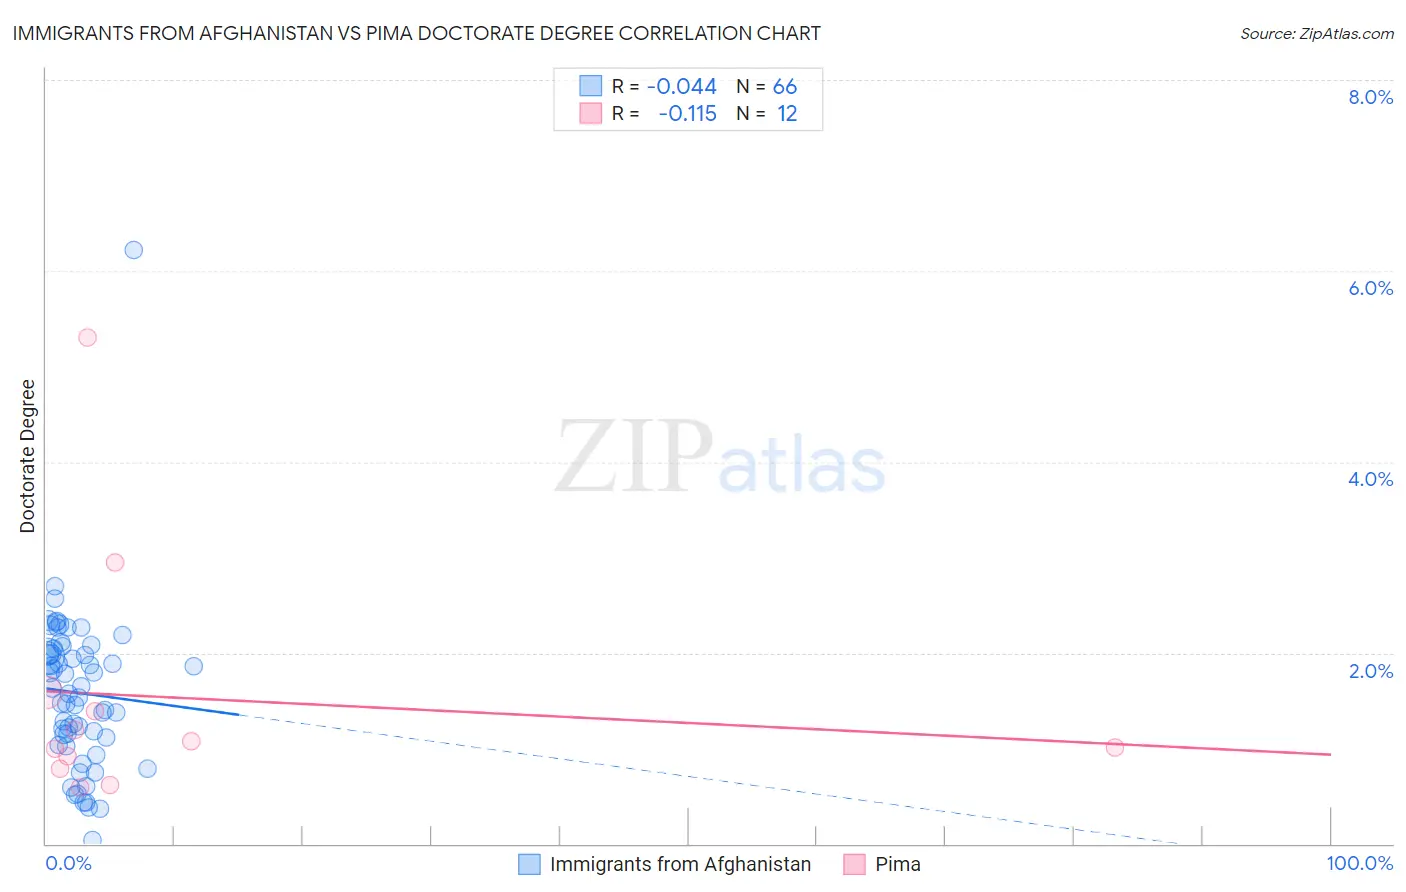
Immigrants from Afghanistan vs Pima Doctorate Degree Correlation Chart
The statistical analysis conducted on geographies consisting of 147,399,207 people shows no correlation between the proportion of Immigrants from Afghanistan and percentage of population with at least doctorate degree education in the United States with a correlation coefficient (R) of -0.044 and weighted average of 1.8%. Similarly, the statistical analysis conducted on geographies consisting of 61,222,520 people shows a poor negative correlation between the proportion of Pima and percentage of population with at least doctorate degree education in the United States with a correlation coefficient (R) of -0.115 and weighted average of 1.3%, a difference of 38.3%.
Doctorate Degree Correlation Summary
| Measurement | Immigrants from Afghanistan | Pima |
| Minimum | 0.038% | 0.59% |
| Maximum | 6.2% | 5.3% |
| Range | 6.2% | 4.7% |
| Mean | 1.6% | 1.5% |
| Median | 1.6% | 1.0% |
| Interquartile 25% (IQ1) | 1.1% | 0.85% |
| Interquartile 75% (IQ3) | 2.0% | 1.5% |
| Interquartile Range (IQR) | 0.88% | 0.64% |
| Standard Deviation (Sample) | 0.86% | 1.3% |
| Standard Deviation (Population) | 0.85% | 1.3% |
Similar Demographics by Doctorate Degree
Demographics Similar to Immigrants from Afghanistan by Doctorate Degree
In terms of doctorate degree, the demographic groups most similar to Immigrants from Afghanistan are Immigrants (1.8%, a difference of 0.29%), Finnish (1.8%, a difference of 0.34%), Scandinavian (1.8%, a difference of 0.55%), Ghanaian (1.8%, a difference of 0.60%), and Nigerian (1.8%, a difference of 0.66%).
| Demographics | Rating | Rank | Doctorate Degree |
| Immigrants | Thailand | 49.4 /100 | #175 | Average 1.8% |
| Spanish | 49.3 /100 | #176 | Average 1.8% |
| Iraqis | 49.2 /100 | #177 | Average 1.8% |
| French | 48.8 /100 | #178 | Average 1.8% |
| Ghanaians | 48.3 /100 | #179 | Average 1.8% |
| Scandinavians | 48.0 /100 | #180 | Average 1.8% |
| Immigrants | Immigrants | 46.2 /100 | #181 | Average 1.8% |
| Immigrants | Afghanistan | 44.3 /100 | #182 | Average 1.8% |
| Finns | 42.1 /100 | #183 | Average 1.8% |
| Nigerians | 39.9 /100 | #184 | Fair 1.8% |
| Slovaks | 36.4 /100 | #185 | Fair 1.8% |
| Peruvians | 34.4 /100 | #186 | Fair 1.8% |
| Czechoslovakians | 33.0 /100 | #187 | Fair 1.8% |
| Germans | 30.5 /100 | #188 | Fair 1.8% |
| French Canadians | 30.2 /100 | #189 | Fair 1.8% |
Demographics Similar to Pima by Doctorate Degree
In terms of doctorate degree, the demographic groups most similar to Pima are Immigrants from Cabo Verde (1.3%, a difference of 0.020%), Hispanic or Latino (1.3%, a difference of 0.31%), Native/Alaskan (1.3%, a difference of 0.39%), Immigrants from Belize (1.3%, a difference of 0.72%), and Inupiat (1.3%, a difference of 0.89%).
| Demographics | Rating | Rank | Doctorate Degree |
| Creek | 0.1 /100 | #318 | Tragic 1.3% |
| Immigrants | Guyana | 0.1 /100 | #319 | Tragic 1.3% |
| Immigrants | St. Vincent and the Grenadines | 0.1 /100 | #320 | Tragic 1.3% |
| Dutch West Indians | 0.1 /100 | #321 | Tragic 1.3% |
| Seminole | 0.1 /100 | #322 | Tragic 1.3% |
| Immigrants | Belize | 0.1 /100 | #323 | Tragic 1.3% |
| Natives/Alaskans | 0.0 /100 | #324 | Tragic 1.3% |
| Pima | 0.0 /100 | #325 | Tragic 1.3% |
| Immigrants | Cabo Verde | 0.0 /100 | #326 | Tragic 1.3% |
| Hispanics or Latinos | 0.0 /100 | #327 | Tragic 1.3% |
| Inupiat | 0.0 /100 | #328 | Tragic 1.3% |
| Haitians | 0.0 /100 | #329 | Tragic 1.3% |
| Yup'ik | 0.0 /100 | #330 | Tragic 1.3% |
| Immigrants | Latin America | 0.0 /100 | #331 | Tragic 1.3% |
| Yakama | 0.0 /100 | #332 | Tragic 1.3% |