Immigrants from Afghanistan vs Immigrants from Yemen Associate's Degree
COMPARE
Immigrants from Afghanistan
Immigrants from Yemen
Associate's Degree
Associate's Degree Comparison
Immigrants from Afghanistan
Immigrants from Yemen
47.3%
ASSOCIATE'S DEGREE
74.3/ 100
METRIC RATING
152nd/ 347
METRIC RANK
37.3%
ASSOCIATE'S DEGREE
0.0/ 100
METRIC RATING
321st/ 347
METRIC RANK
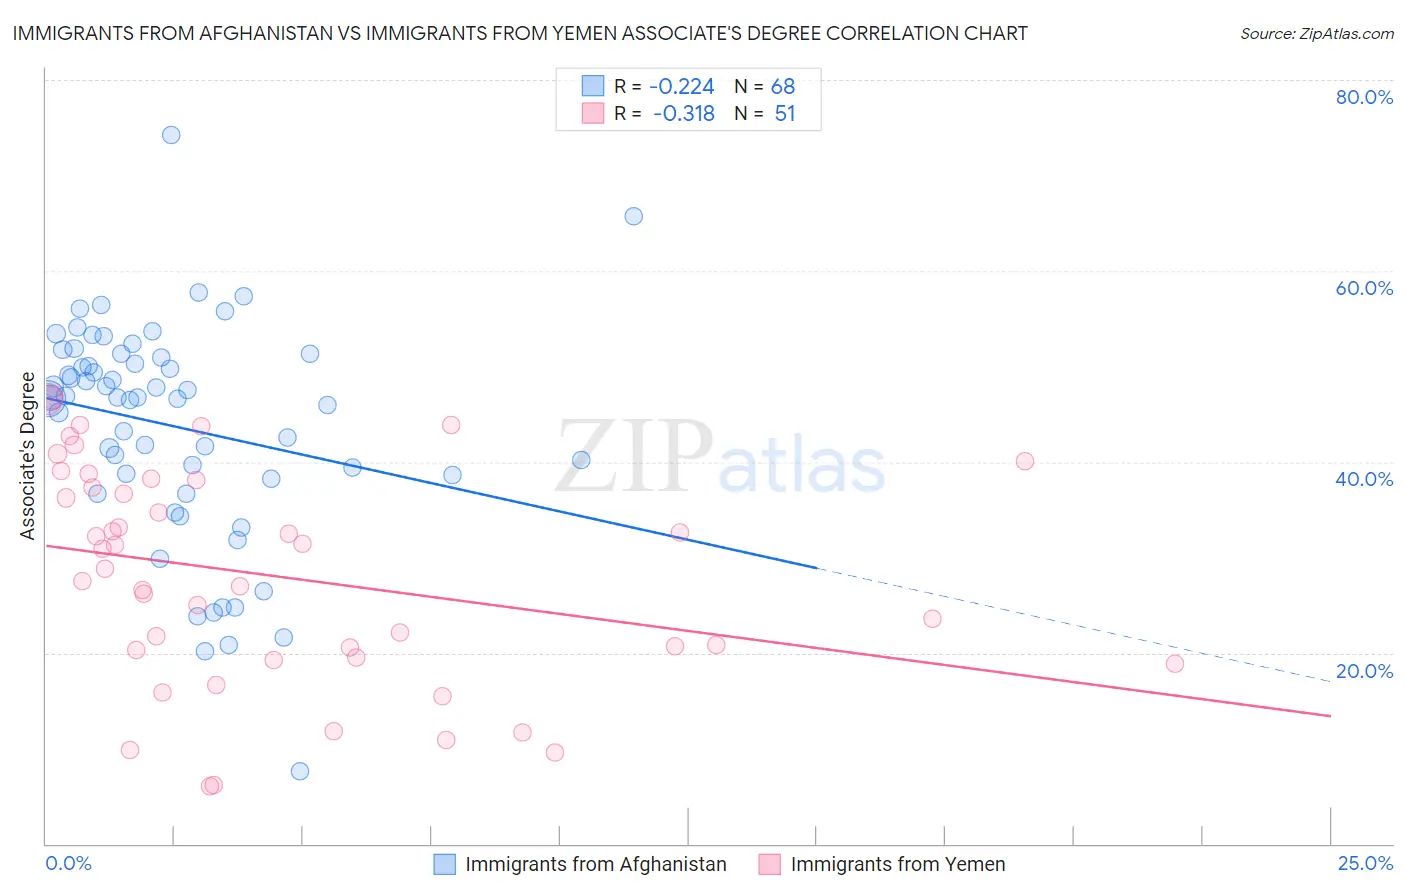
Immigrants from Afghanistan vs Immigrants from Yemen Associate's Degree Correlation Chart
The statistical analysis conducted on geographies consisting of 147,646,385 people shows a weak negative correlation between the proportion of Immigrants from Afghanistan and percentage of population with at least associate's degree education in the United States with a correlation coefficient (R) of -0.224 and weighted average of 47.3%. Similarly, the statistical analysis conducted on geographies consisting of 82,433,611 people shows a mild negative correlation between the proportion of Immigrants from Yemen and percentage of population with at least associate's degree education in the United States with a correlation coefficient (R) of -0.318 and weighted average of 37.3%, a difference of 26.6%.
Associate's Degree Correlation Summary
| Measurement | Immigrants from Afghanistan | Immigrants from Yemen |
| Minimum | 7.6% | 6.0% |
| Maximum | 74.2% | 46.7% |
| Range | 66.6% | 40.7% |
| Mean | 43.7% | 28.0% |
| Median | 46.7% | 28.8% |
| Interquartile 25% (IQ1) | 38.4% | 19.5% |
| Interquartile 75% (IQ3) | 51.1% | 38.1% |
| Interquartile Range (IQR) | 12.7% | 18.6% |
| Standard Deviation (Sample) | 11.6% | 11.4% |
| Standard Deviation (Population) | 11.5% | 11.3% |
Similar Demographics by Associate's Degree
Demographics Similar to Immigrants from Afghanistan by Associate's Degree
In terms of associate's degree, the demographic groups most similar to Immigrants from Afghanistan are Immigrants from North Macedonia (47.4%, a difference of 0.17%), Iraqi (47.4%, a difference of 0.19%), Czech (47.2%, a difference of 0.19%), Immigrants from Kenya (47.2%, a difference of 0.20%), and Immigrants from Armenia (47.4%, a difference of 0.23%).
| Demographics | Rating | Rank | Associate's Degree |
| Canadians | 79.0 /100 | #145 | Good 47.5% |
| Immigrants | Sudan | 77.9 /100 | #146 | Good 47.4% |
| Danes | 77.3 /100 | #147 | Good 47.4% |
| South American Indians | 76.7 /100 | #148 | Good 47.4% |
| Immigrants | Armenia | 76.6 /100 | #149 | Good 47.4% |
| Iraqis | 76.2 /100 | #150 | Good 47.4% |
| Immigrants | North Macedonia | 76.0 /100 | #151 | Good 47.4% |
| Immigrants | Afghanistan | 74.3 /100 | #152 | Good 47.3% |
| Czechs | 72.2 /100 | #153 | Good 47.2% |
| Immigrants | Kenya | 72.1 /100 | #154 | Good 47.2% |
| Kenyans | 70.6 /100 | #155 | Good 47.1% |
| South Americans | 70.5 /100 | #156 | Good 47.1% |
| Sudanese | 70.3 /100 | #157 | Good 47.1% |
| Immigrants | Germany | 69.7 /100 | #158 | Good 47.1% |
| Immigrants | Poland | 69.2 /100 | #159 | Good 47.1% |
Demographics Similar to Immigrants from Yemen by Associate's Degree
In terms of associate's degree, the demographic groups most similar to Immigrants from Yemen are Cajun (37.4%, a difference of 0.12%), Fijian (37.4%, a difference of 0.15%), Pennsylvania German (37.2%, a difference of 0.29%), Alaska Native (37.5%, a difference of 0.37%), and Yaqui (37.6%, a difference of 0.60%).
| Demographics | Rating | Rank | Associate's Degree |
| Seminole | 0.0 /100 | #314 | Tragic 37.7% |
| Creek | 0.0 /100 | #315 | Tragic 37.6% |
| Crow | 0.0 /100 | #316 | Tragic 37.6% |
| Yaqui | 0.0 /100 | #317 | Tragic 37.6% |
| Alaska Natives | 0.0 /100 | #318 | Tragic 37.5% |
| Fijians | 0.0 /100 | #319 | Tragic 37.4% |
| Cajuns | 0.0 /100 | #320 | Tragic 37.4% |
| Immigrants | Yemen | 0.0 /100 | #321 | Tragic 37.3% |
| Pennsylvania Germans | 0.0 /100 | #322 | Tragic 37.2% |
| Immigrants | Cabo Verde | 0.0 /100 | #323 | Tragic 36.8% |
| Arapaho | 0.0 /100 | #324 | Tragic 36.7% |
| Menominee | 0.0 /100 | #325 | Tragic 36.7% |
| Kiowa | 0.0 /100 | #326 | Tragic 36.5% |
| Dutch West Indians | 0.0 /100 | #327 | Tragic 36.5% |
| Alaskan Athabascans | 0.0 /100 | #328 | Tragic 36.5% |