Immigrants from Afghanistan vs Immigrants from Uzbekistan High School Diploma
COMPARE
Immigrants from Afghanistan
Immigrants from Uzbekistan
High School Diploma
High School Diploma Comparison
Immigrants from Afghanistan
Immigrants from Uzbekistan
88.3%
HIGH SCHOOL DIPLOMA
8.6/ 100
METRIC RATING
221st/ 347
METRIC RANK
87.8%
HIGH SCHOOL DIPLOMA
2.1/ 100
METRIC RATING
241st/ 347
METRIC RANK
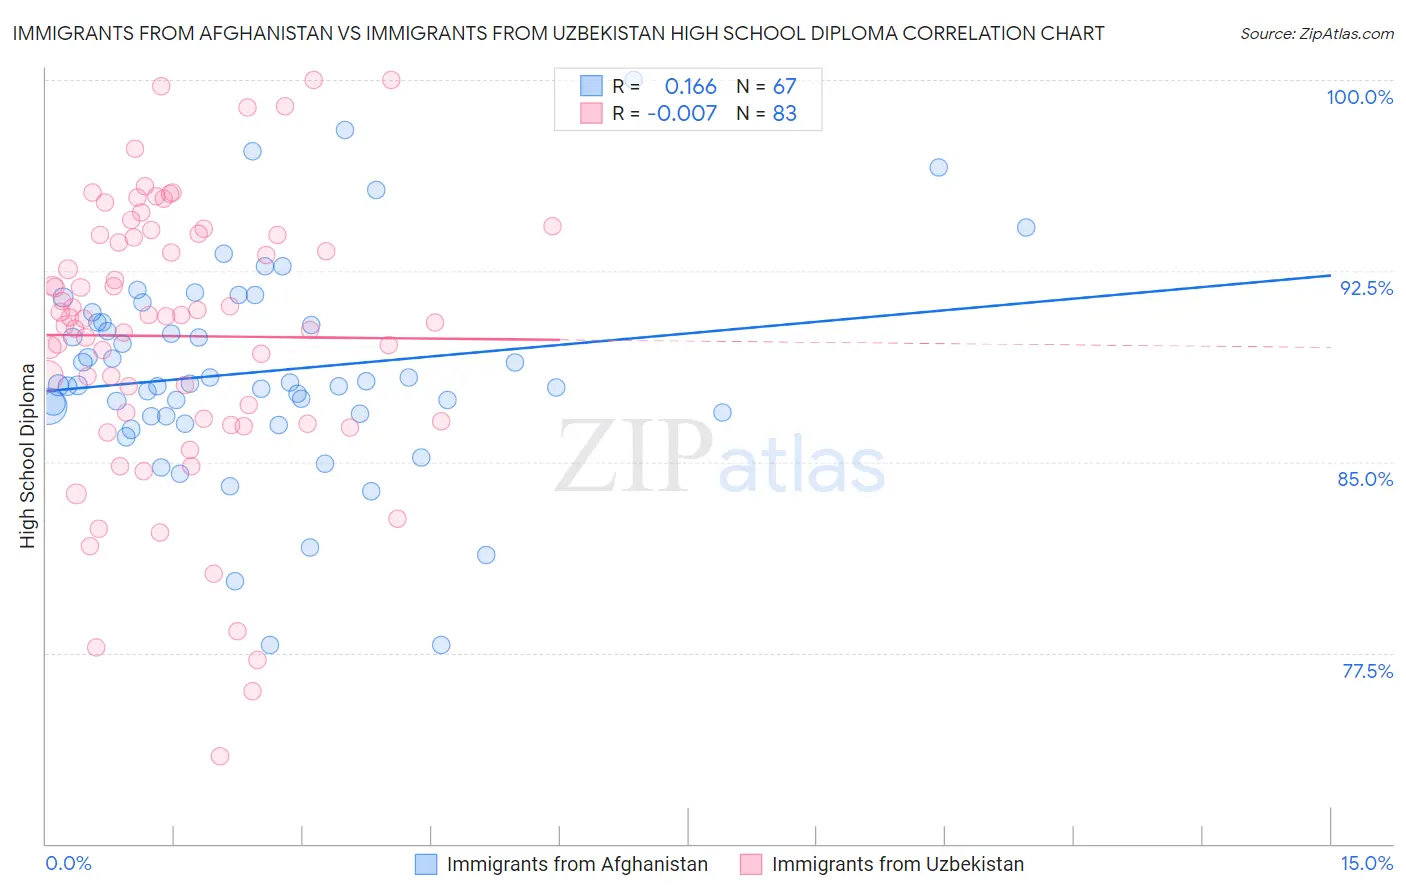
Immigrants from Afghanistan vs Immigrants from Uzbekistan High School Diploma Correlation Chart
The statistical analysis conducted on geographies consisting of 147,629,579 people shows a poor positive correlation between the proportion of Immigrants from Afghanistan and percentage of population with at least high school diploma education in the United States with a correlation coefficient (R) of 0.166 and weighted average of 88.3%. Similarly, the statistical analysis conducted on geographies consisting of 118,765,305 people shows no correlation between the proportion of Immigrants from Uzbekistan and percentage of population with at least high school diploma education in the United States with a correlation coefficient (R) of -0.007 and weighted average of 87.8%, a difference of 0.57%.
High School Diploma Correlation Summary
| Measurement | Immigrants from Afghanistan | Immigrants from Uzbekistan |
| Minimum | 77.8% | 73.4% |
| Maximum | 100.0% | 100.0% |
| Range | 22.2% | 26.6% |
| Mean | 88.5% | 89.9% |
| Median | 88.0% | 90.7% |
| Interquartile 25% (IQ1) | 86.8% | 86.6% |
| Interquartile 75% (IQ3) | 90.5% | 93.9% |
| Interquartile Range (IQR) | 3.7% | 7.3% |
| Standard Deviation (Sample) | 4.1% | 5.5% |
| Standard Deviation (Population) | 4.1% | 5.5% |
Demographics Similar to Immigrants from Afghanistan and Immigrants from Uzbekistan by High School Diploma
In terms of high school diploma, the demographic groups most similar to Immigrants from Afghanistan are Colville (88.3%, a difference of 0.040%), Immigrants from Zaire (88.3%, a difference of 0.050%), Shoshone (88.3%, a difference of 0.090%), Creek (88.3%, a difference of 0.090%), and Uruguayan (88.2%, a difference of 0.17%). Similarly, the demographic groups most similar to Immigrants from Uzbekistan are Comanche (87.9%, a difference of 0.030%), Taiwanese (87.9%, a difference of 0.11%), Sioux (87.9%, a difference of 0.11%), South American (87.9%, a difference of 0.11%), and Subsaharan African (87.9%, a difference of 0.12%).
| Demographics | Rating | Rank | High School Diploma |
| Immigrants | Afghanistan | 8.6 /100 | #221 | Tragic 88.3% |
| Colville | 7.8 /100 | #222 | Tragic 88.3% |
| Immigrants | Zaire | 7.6 /100 | #223 | Tragic 88.3% |
| Shoshone | 7.0 /100 | #224 | Tragic 88.3% |
| Creek | 6.9 /100 | #225 | Tragic 88.3% |
| Uruguayans | 5.6 /100 | #226 | Tragic 88.2% |
| Immigrants | Liberia | 5.5 /100 | #227 | Tragic 88.2% |
| Kiowa | 5.3 /100 | #228 | Tragic 88.2% |
| Nigerians | 5.2 /100 | #229 | Tragic 88.2% |
| Blackfeet | 4.2 /100 | #230 | Tragic 88.1% |
| Colombians | 3.8 /100 | #231 | Tragic 88.1% |
| Immigrants | Middle Africa | 3.4 /100 | #232 | Tragic 88.0% |
| Immigrants | Panama | 3.1 /100 | #233 | Tragic 88.0% |
| Immigrants | Thailand | 3.1 /100 | #234 | Tragic 88.0% |
| Immigrants | Bahamas | 2.9 /100 | #235 | Tragic 88.0% |
| Sub-Saharan Africans | 2.8 /100 | #236 | Tragic 87.9% |
| Taiwanese | 2.8 /100 | #237 | Tragic 87.9% |
| Sioux | 2.7 /100 | #238 | Tragic 87.9% |
| South Americans | 2.7 /100 | #239 | Tragic 87.9% |
| Comanche | 2.2 /100 | #240 | Tragic 87.9% |
| Immigrants | Uzbekistan | 2.1 /100 | #241 | Tragic 87.8% |