Immigrants from Afghanistan vs Immigrants from Lithuania 5th Grade

COMPARE

Immigrants from Afghanistan
Race
Ancestry
AfghanAfricanAlaska NativeAlaskan AthabascanAlbanianAleutAlsatianAmericanApacheArabArapahoArgentineanArmenianAssyrian/Chaldean/SyriacAustralianAustrianBahamianBangladeshiBarbadianBasqueBelgianBelizeanBermudanBhutaneseBlackfeetBolivianBrazilianBritishBritish West IndianBulgarianBurmeseCajunCambodianCanadianCape VerdeanCarpatho RusynCelticCentral AmericanCentral American IndianCherokeeCheyenneChickasawChileanChineseChippewaChoctawColombianColvilleComancheCosta RicanCreeCreekCroatianCrowCubanCypriotCzechCzechoslovakianDanishDelawareDominicanDutchDutch West IndianEastern EuropeanEcuadorianEgyptianEnglishEstonianEthiopianEuropeanFijianFilipinoFinnishFrenchFrench American IndianFrench CanadianGermanGerman RussianGhanaianGreekGuamanian/ChamorroGuatemalanGuyaneseHaitianHmongHonduranHopiHoumaHungarianIcelanderIndian (Asian)IndonesianInupiatIranianIraqiIrishIroquoisIsraeliItalianJamaicanJapaneseJordanianKenyanKiowaKoreanLaotianLatvianLebaneseLiberianLithuanianLumbeeLuxembourgerMacedonianMalaysianMalteseMarshalleseMenomineeMexicanMexican American IndianMongolianMoroccanNative HawaiianNavajoNepaleseNew ZealanderNicaraguanNigerianNorthern EuropeanNorwegianOkinawanOsageOttawaPaiutePakistaniPalestinianPanamanianParaguayanPennsylvania GermanPeruvianPimaPolishPortuguesePotawatomiPuebloPuerto RicanPuget Sound SalishRomanianRussianSalvadoranSamoanScandinavianScotch-IrishScottishSeminoleSenegaleseSerbianShoshoneSierra LeoneanSiouxSlavicSlovakSloveneSomaliSouth AfricanSouth AmericanSouth American IndianSoviet UnionSpaniardSpanishSpanish AmericanSpanish American IndianSri LankanSubsaharan AfricanSudaneseSwedishSwissSyrianTaiwaneseThaiTlingit-HaidaTohono O'OdhamTonganTrinidadian and TobagonianTsimshianTurkishU.S. Virgin IslanderUgandanUkrainianUruguayanUteVenezuelanVietnameseWelshWest IndianYakamaYaquiYugoslavianYumanYup'ikZimbabwean
Immigration
NonimmigrantsImmigrantsAfghanistanAfricaAlbaniaArgentinaArmeniaAsiaAustraliaAustriaBahamasBangladeshBarbadosBelarusBelgiumBelizeBoliviaBosnia and HerzegovinaBrazilBulgariaBurma/MyanmarCabo VerdeCambodiaCameroonCanadaCaribbeanCentral AmericaChileChinaColombiaCongoCosta RicaCroatiaCubaCzechoslovakiaDenmarkDominicaDominican RepublicEastern AfricaEastern AsiaEastern EuropeEcuadorEgyptEl SalvadorEnglandEritreaEthiopiaEuropeFijiFranceGermanyGhanaGreeceGrenadaGuatemalaGuyanaHaitiHondurasHong KongHungaryIndiaIndonesiaIranIraqIrelandIsraelItalyJamaicaJapanJordanKazakhstanKenyaKoreaKuwaitLaosLatin AmericaLatviaLebanonLiberiaMalaysiaMexicoMicronesiaMiddle AfricaMoldovaMoroccoNepalNetherlandsNicaraguaNigeriaNorth AmericaNorth MacedoniaNorthern AfricaNorthern EuropeNorwayOceaniaPakistanPanamaPeruPhilippinesPolandPortugalRomaniaRussiaSaudi ArabiaScotlandSenegalSerbiaSierra LeoneSingaporeSomaliaSouth AfricaSouth AmericaSouth Central AsiaSouth Eastern AsiaSouthern EuropeSpainSri LankaSt. Vincent and the GrenadinesSudanSwedenSwitzerlandSyriaTaiwanThailandTrinidad and TobagoTurkeyUgandaUkraineUruguayUzbekistanVenezuelaVietnamWest IndiesWestern AfricaWestern AsiaWestern EuropeYemenZaireZimbabweAzores
Immigrants from Lithuania
Race
Ancestry
AfghanAfricanAlaska NativeAlaskan AthabascanAlbanianAleutAlsatianAmericanApacheArabArapahoArgentineanArmenianAssyrian/Chaldean/SyriacAustralianAustrianBahamianBangladeshiBarbadianBasqueBelgianBelizeanBermudanBhutaneseBlackfeetBolivianBrazilianBritishBritish West IndianBulgarianBurmeseCajunCambodianCanadianCape VerdeanCarpatho RusynCelticCentral AmericanCentral American IndianCherokeeCheyenneChickasawChileanChineseChippewaChoctawColombianColvilleComancheCosta RicanCreeCreekCroatianCrowCubanCypriotCzechCzechoslovakianDanishDelawareDominicanDutchDutch West IndianEastern EuropeanEcuadorianEgyptianEnglishEstonianEthiopianEuropeanFijianFilipinoFinnishFrenchFrench American IndianFrench CanadianGermanGerman RussianGhanaianGreekGuamanian/ChamorroGuatemalanGuyaneseHaitianHmongHonduranHopiHoumaHungarianIcelanderIndian (Asian)IndonesianInupiatIranianIraqiIrishIroquoisIsraeliItalianJamaicanJapaneseJordanianKenyanKiowaKoreanLaotianLatvianLebaneseLiberianLithuanianLumbeeLuxembourgerMacedonianMalaysianMalteseMarshalleseMenomineeMexicanMexican American IndianMongolianMoroccanNative HawaiianNavajoNepaleseNew ZealanderNicaraguanNigerianNorthern EuropeanNorwegianOkinawanOsageOttawaPaiutePakistaniPalestinianPanamanianParaguayanPennsylvania GermanPeruvianPimaPolishPortuguesePotawatomiPuebloPuerto RicanPuget Sound SalishRomanianRussianSalvadoranSamoanScandinavianScotch-IrishScottishSeminoleSenegaleseSerbianShoshoneSierra LeoneanSiouxSlavicSlovakSloveneSomaliSouth AfricanSouth AmericanSouth American IndianSoviet UnionSpaniardSpanishSpanish AmericanSpanish American IndianSri LankanSubsaharan AfricanSudaneseSwedishSwissSyrianTaiwaneseThaiTlingit-HaidaTohono O'OdhamTonganTrinidadian and TobagonianTsimshianTurkishU.S. Virgin IslanderUgandanUkrainianUruguayanUteVenezuelanVietnameseWelshWest IndianYakamaYaquiYugoslavianYumanYup'ikZimbabwean
Immigration
NonimmigrantsImmigrantsAfricaAlbaniaArgentinaArmeniaAsiaAustraliaAustriaBahamasBangladeshBarbadosBelarusBelgiumBelizeBoliviaBosnia and HerzegovinaBrazilBulgariaBurma/MyanmarCabo VerdeCambodiaCameroonCanadaCaribbeanCentral AmericaChileChinaColombiaCongoCosta RicaCroatiaCubaCzechoslovakiaDenmarkDominicaDominican RepublicEastern AfricaEastern AsiaEastern EuropeEcuadorEgyptEl SalvadorEnglandEritreaEthiopiaEuropeFijiFranceGermanyGhanaGreeceGrenadaGuatemalaGuyanaHaitiHondurasHong KongHungaryIndiaIndonesiaIranIraqIrelandIsraelItalyJamaicaJapanJordanKazakhstanKenyaKoreaKuwaitLaosLatin AmericaLatviaLebanonLiberiaLithuaniaMalaysiaMexicoMicronesiaMiddle AfricaMoldovaMoroccoNepalNetherlandsNicaraguaNigeriaNorth AmericaNorth MacedoniaNorthern AfricaNorthern EuropeNorwayOceaniaPakistanPanamaPeruPhilippinesPolandPortugalRomaniaRussiaSaudi ArabiaScotlandSenegalSerbiaSierra LeoneSingaporeSomaliaSouth AfricaSouth AmericaSouth Central AsiaSouth Eastern AsiaSouthern EuropeSpainSri LankaSt. Vincent and the GrenadinesSudanSwedenSwitzerlandSyriaTaiwanThailandTrinidad and TobagoTurkeyUgandaUkraineUruguayUzbekistanVenezuelaVietnamWest IndiesWestern AfricaWestern AsiaWestern EuropeYemenZaireZimbabweAzores
5th Grade
Income
Poverty
Unemployment
Labor Participation
Family Structure
Vehicle Availability
Education Level
Disability

5th Grade Comparison

Immigrants from Afghanistan

Immigrants from Lithuania

Tragic
Exceptional
96.6%
5TH GRADE
0.1/ 100
METRIC RATING
287th/ 347
METRIC RANK
97.8%
5TH GRADE
99.2/ 100
METRIC RATING
79th/ 347
METRIC RANK

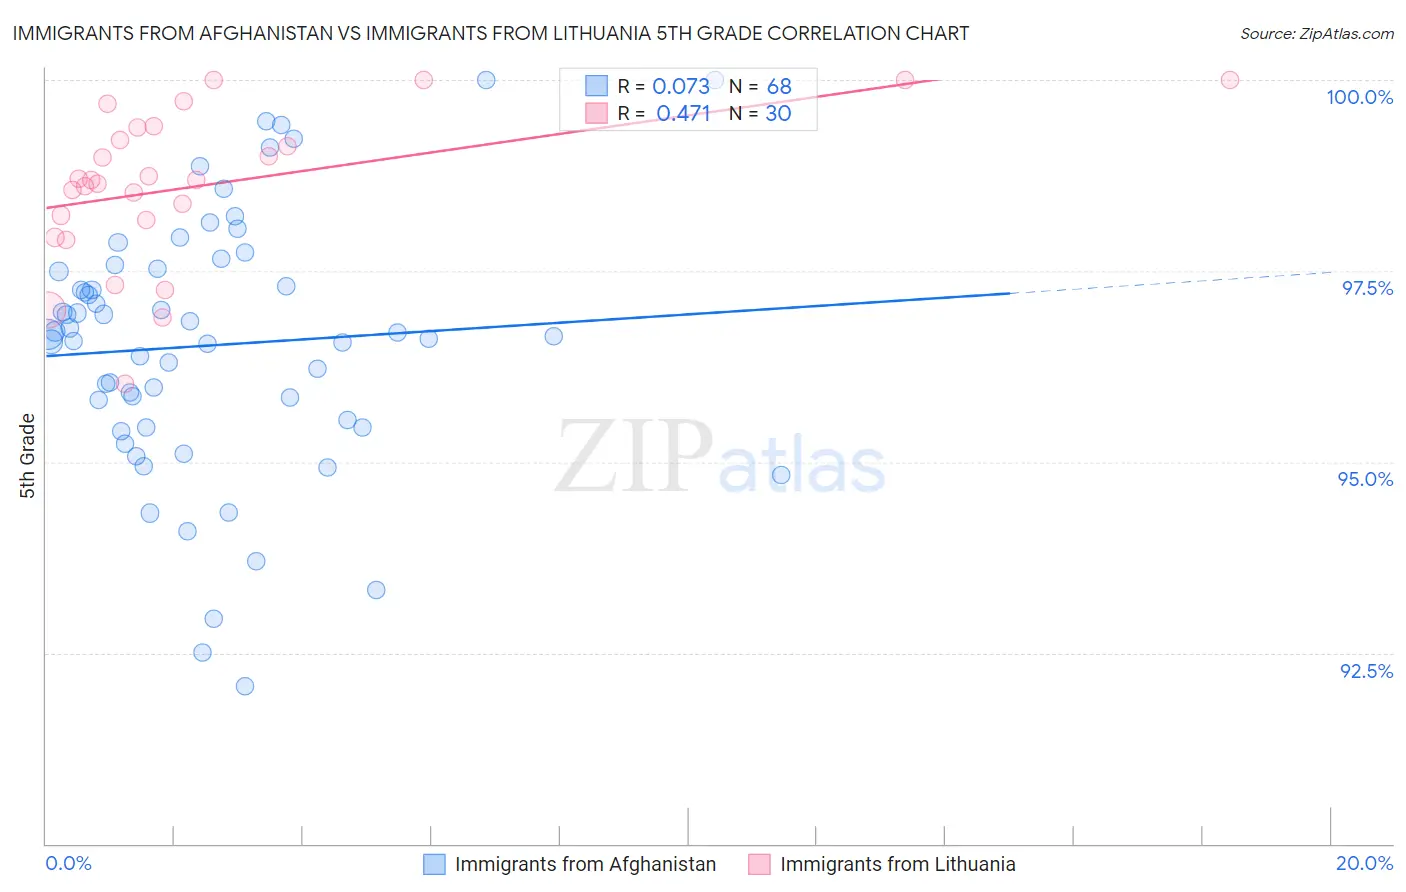
Immigrants from Afghanistan vs Immigrants from Lithuania 5th Grade Correlation Chart

The statistical analysis conducted on geographies consisting of 147,629,924 people shows a slight positive correlation between the proportion of Immigrants from Afghanistan and percentage of population with at least 5th grade education in the United States with a correlation coefficient (R) of 0.073 and weighted average of 96.6%. Similarly, the statistical analysis conducted on geographies consisting of 117,724,932 people shows a moderate positive correlation between the proportion of Immigrants from Lithuania and percentage of population with at least 5th grade education in the United States with a correlation coefficient (R) of 0.471 and weighted average of 97.8%, a difference of 1.3%.
Immigrants from Afghanistan vs Immigrants from Lithuania 5th Grade

5th Grade Correlation Summary

MeasurementImmigrants from AfghanistanImmigrants from Lithuania
Minimum92.1%96.0%
Maximum100.0%100.0%
Range7.9%4.0%
Mean96.5%98.6%
Median96.7%98.7%
Interquartile 25% (IQ1)95.5%98.2%
Interquartile 75% (IQ3)97.5%99.4%
Interquartile Range (IQR)2.0%1.2%
Standard Deviation (Sample)1.7%1.0%
Standard Deviation (Population)1.7%0.99%

Similar Demographics by 5th Grade

Demographics Similar to Immigrants from Afghanistan by 5th Grade

In terms of 5th grade, the demographic groups most similar to Immigrants from Afghanistan are Immigrants from Barbados (96.6%, a difference of 0.010%), Immigrants from St. Vincent and the Grenadines (96.6%, a difference of 0.030%), Immigrants from Thailand (96.6%, a difference of 0.030%), Immigrants from Trinidad and Tobago (96.6%, a difference of 0.040%), and Immigrants from Western Africa (96.6%, a difference of 0.050%).
DemographicsRating | Rank5th Grade
Immigrants | Western Africa
0.1
/100
|
#280
Tragic
96.6%
Houma
0.1
/100
|
#281
Tragic
96.6%
Barbadians
0.1
/100
|
#282
Tragic
96.6%
Fijians
0.1
/100
|
#283
Tragic
96.6%
Immigrants | Trinidad and Tobago
0.1
/100
|
#284
Tragic
96.6%
Immigrants | St. Vincent and the Grenadines
0.1
/100
|
#285
Tragic
96.6%
Immigrants | Thailand
0.1
/100
|
#286
Tragic
96.6%
Immigrants | Afghanistan
0.1
/100
|
#287
Tragic
96.6%
Immigrants | Barbados
0.0
/100
|
#288
Tragic
96.6%
Immigrants | West Indies
0.0
/100
|
#289
Tragic
96.5%
British West Indians
0.0
/100
|
#290
Tragic
96.5%
Malaysians
0.0
/100
|
#291
Tragic
96.5%
Somalis
0.0
/100
|
#292
Tragic
96.5%
Immigrants | Grenada
0.0
/100
|
#293
Tragic
96.5%
Immigrants | Eritrea
0.0
/100
|
#294
Tragic
96.4%

Demographics Similar to Immigrants from Lithuania by 5th Grade

In terms of 5th grade, the demographic groups most similar to Immigrants from Lithuania are Immigrants from India (97.8%, a difference of 0.0%), Icelander (97.8%, a difference of 0.0%), Ukrainian (97.8%, a difference of 0.010%), Immigrants from Netherlands (97.8%, a difference of 0.010%), and Immigrants from England (97.8%, a difference of 0.010%).
DemographicsRating | Rank5th Grade
Macedonians
99.4
/100
|
#72
Exceptional
97.9%
Cherokee
99.4
/100
|
#73
Exceptional
97.8%
Lumbee
99.3
/100
|
#74
Exceptional
97.8%
Ukrainians
99.3
/100
|
#75
Exceptional
97.8%
Immigrants | Netherlands
99.3
/100
|
#76
Exceptional
97.8%
Immigrants | England
99.3
/100
|
#77
Exceptional
97.8%
Osage
99.3
/100
|
#78
Exceptional
97.8%
Immigrants | Lithuania
99.2
/100
|
#79
Exceptional
97.8%
Immigrants | India
99.2
/100
|
#80
Exceptional
97.8%
Icelanders
99.2
/100
|
#81
Exceptional
97.8%
Pueblo
99.2
/100
|
#82
Exceptional
97.8%
Zimbabweans
99.0
/100
|
#83
Exceptional
97.8%
Potawatomi
99.0
/100
|
#84
Exceptional
97.8%
Immigrants | Belgium
99.0
/100
|
#85
Exceptional
97.8%
Cypriots
98.9
/100
|
#86
Exceptional
97.8%