Immigrants from Afghanistan vs Bangladeshi Professional Degree

COMPARE

Immigrants from Afghanistan
Race
Ancestry
AfghanAfricanAlaska NativeAlaskan AthabascanAlbanianAleutAlsatianAmericanApacheArabArapahoArgentineanArmenianAssyrian/Chaldean/SyriacAustralianAustrianBahamianBarbadianBasqueBelgianBelizeanBermudanBhutaneseBlackfeetBolivianBrazilianBritishBritish West IndianBulgarianBurmeseCajunCambodianCanadianCape VerdeanCarpatho RusynCelticCentral AmericanCentral American IndianCherokeeCheyenneChickasawChileanChineseChippewaChoctawColombianColvilleComancheCosta RicanCreeCreekCroatianCrowCubanCypriotCzechCzechoslovakianDanishDelawareDominicanDutchDutch West IndianEastern EuropeanEcuadorianEgyptianEnglishEstonianEthiopianEuropeanFijianFilipinoFinnishFrenchFrench American IndianFrench CanadianGermanGerman RussianGhanaianGreekGuamanian/ChamorroGuatemalanGuyaneseHaitianHmongHonduranHopiHoumaHungarianIcelanderIndian (Asian)IndonesianInupiatIranianIraqiIrishIroquoisIsraeliItalianJamaicanJapaneseJordanianKenyanKiowaKoreanLaotianLatvianLebaneseLiberianLithuanianLumbeeLuxembourgerMacedonianMalaysianMalteseMarshalleseMenomineeMexicanMexican American IndianMongolianMoroccanNative HawaiianNavajoNepaleseNew ZealanderNicaraguanNigerianNorthern EuropeanNorwegianOkinawanOsageOttawaPaiutePakistaniPalestinianPanamanianParaguayanPennsylvania GermanPeruvianPimaPolishPortuguesePotawatomiPuebloPuerto RicanPuget Sound SalishRomanianRussianSalvadoranSamoanScandinavianScotch-IrishScottishSeminoleSenegaleseSerbianShoshoneSierra LeoneanSiouxSlavicSlovakSloveneSomaliSouth AfricanSouth AmericanSouth American IndianSoviet UnionSpaniardSpanishSpanish AmericanSpanish American IndianSri LankanSubsaharan AfricanSudaneseSwedishSwissSyrianTaiwaneseThaiTlingit-HaidaTohono O'OdhamTonganTrinidadian and TobagonianTsimshianTurkishU.S. Virgin IslanderUgandanUkrainianUruguayanUteVenezuelanVietnameseWelshWest IndianYakamaYaquiYugoslavianYumanYup'ikZimbabwean
Immigration
NonimmigrantsImmigrantsAfghanistanAfricaAlbaniaArgentinaArmeniaAsiaAustraliaAustriaBahamasBangladeshBarbadosBelarusBelgiumBelizeBoliviaBosnia and HerzegovinaBrazilBulgariaBurma/MyanmarCabo VerdeCambodiaCameroonCanadaCaribbeanCentral AmericaChileChinaColombiaCongoCosta RicaCroatiaCubaCzechoslovakiaDenmarkDominicaDominican RepublicEastern AfricaEastern AsiaEastern EuropeEcuadorEgyptEl SalvadorEnglandEritreaEthiopiaEuropeFijiFranceGermanyGhanaGreeceGrenadaGuatemalaGuyanaHaitiHondurasHong KongHungaryIndiaIndonesiaIranIraqIrelandIsraelItalyJamaicaJapanJordanKazakhstanKenyaKoreaKuwaitLaosLatin AmericaLatviaLebanonLiberiaLithuaniaMalaysiaMexicoMicronesiaMiddle AfricaMoldovaMoroccoNepalNetherlandsNicaraguaNigeriaNorth AmericaNorth MacedoniaNorthern AfricaNorthern EuropeNorwayOceaniaPakistanPanamaPeruPhilippinesPolandPortugalRomaniaRussiaSaudi ArabiaScotlandSenegalSerbiaSierra LeoneSingaporeSomaliaSouth AfricaSouth AmericaSouth Central AsiaSouth Eastern AsiaSouthern EuropeSpainSri LankaSt. Vincent and the GrenadinesSudanSwedenSwitzerlandSyriaTaiwanThailandTrinidad and TobagoTurkeyUgandaUkraineUruguayUzbekistanVenezuelaVietnamWest IndiesWestern AfricaWestern AsiaWestern EuropeYemenZaireZimbabweAzores
Bangladeshi
Race
Ancestry
AfghanAfricanAlaska NativeAlaskan AthabascanAlbanianAleutAlsatianAmericanApacheArabArapahoArgentineanArmenianAssyrian/Chaldean/SyriacAustralianAustrianBahamianBangladeshiBarbadianBasqueBelgianBelizeanBermudanBhutaneseBlackfeetBolivianBrazilianBritishBritish West IndianBulgarianBurmeseCajunCambodianCanadianCape VerdeanCarpatho RusynCelticCentral AmericanCentral American IndianCherokeeCheyenneChickasawChileanChineseChippewaChoctawColombianColvilleComancheCosta RicanCreeCreekCroatianCrowCubanCypriotCzechCzechoslovakianDanishDelawareDominicanDutchDutch West IndianEastern EuropeanEcuadorianEgyptianEnglishEstonianEthiopianEuropeanFijianFilipinoFinnishFrenchFrench American IndianFrench CanadianGermanGerman RussianGhanaianGreekGuamanian/ChamorroGuatemalanGuyaneseHaitianHmongHonduranHopiHoumaHungarianIcelanderIndian (Asian)IndonesianInupiatIranianIraqiIrishIroquoisIsraeliItalianJamaicanJapaneseJordanianKenyanKiowaKoreanLaotianLatvianLebaneseLiberianLithuanianLumbeeLuxembourgerMacedonianMalaysianMalteseMarshalleseMenomineeMexicanMexican American IndianMongolianMoroccanNative HawaiianNavajoNepaleseNew ZealanderNicaraguanNigerianNorthern EuropeanNorwegianOkinawanOsageOttawaPaiutePakistaniPalestinianPanamanianParaguayanPennsylvania GermanPeruvianPimaPolishPortuguesePotawatomiPuebloPuerto RicanPuget Sound SalishRomanianRussianSalvadoranSamoanScandinavianScotch-IrishScottishSeminoleSenegaleseSerbianShoshoneSierra LeoneanSiouxSlavicSlovakSloveneSomaliSouth AfricanSouth AmericanSouth American IndianSoviet UnionSpaniardSpanishSpanish AmericanSpanish American IndianSri LankanSubsaharan AfricanSudaneseSwedishSwissSyrianTaiwaneseThaiTlingit-HaidaTohono O'OdhamTonganTrinidadian and TobagonianTsimshianTurkishU.S. Virgin IslanderUgandanUkrainianUruguayanUteVenezuelanVietnameseWelshWest IndianYakamaYaquiYugoslavianYumanYup'ikZimbabwean
Immigration
NonimmigrantsImmigrantsAfricaAlbaniaArgentinaArmeniaAsiaAustraliaAustriaBahamasBangladeshBarbadosBelarusBelgiumBelizeBoliviaBosnia and HerzegovinaBrazilBulgariaBurma/MyanmarCabo VerdeCambodiaCameroonCanadaCaribbeanCentral AmericaChileChinaColombiaCongoCosta RicaCroatiaCubaCzechoslovakiaDenmarkDominicaDominican RepublicEastern AfricaEastern AsiaEastern EuropeEcuadorEgyptEl SalvadorEnglandEritreaEthiopiaEuropeFijiFranceGermanyGhanaGreeceGrenadaGuatemalaGuyanaHaitiHondurasHong KongHungaryIndiaIndonesiaIranIraqIrelandIsraelItalyJamaicaJapanJordanKazakhstanKenyaKoreaKuwaitLaosLatin AmericaLatviaLebanonLiberiaLithuaniaMalaysiaMexicoMicronesiaMiddle AfricaMoldovaMoroccoNepalNetherlandsNicaraguaNigeriaNorth AmericaNorth MacedoniaNorthern AfricaNorthern EuropeNorwayOceaniaPakistanPanamaPeruPhilippinesPolandPortugalRomaniaRussiaSaudi ArabiaScotlandSenegalSerbiaSierra LeoneSingaporeSomaliaSouth AfricaSouth AmericaSouth Central AsiaSouth Eastern AsiaSouthern EuropeSpainSri LankaSt. Vincent and the GrenadinesSudanSwedenSwitzerlandSyriaTaiwanThailandTrinidad and TobagoTurkeyUgandaUkraineUruguayUzbekistanVenezuelaVietnamWest IndiesWestern AfricaWestern AsiaWestern EuropeYemenZaireZimbabweAzores
Professional Degree
Income
Poverty
Unemployment
Labor Participation
Family Structure
Vehicle Availability
Education Level
Disability

Professional Degree Comparison

Immigrants from Afghanistan

Bangladeshis

Average
Tragic
4.5%
PROFESSIONAL DEGREE
59.2/ 100
METRIC RATING
167th/ 347
METRIC RANK
3.1%
PROFESSIONAL DEGREE
0.0/ 100
METRIC RATING
329th/ 347
METRIC RANK

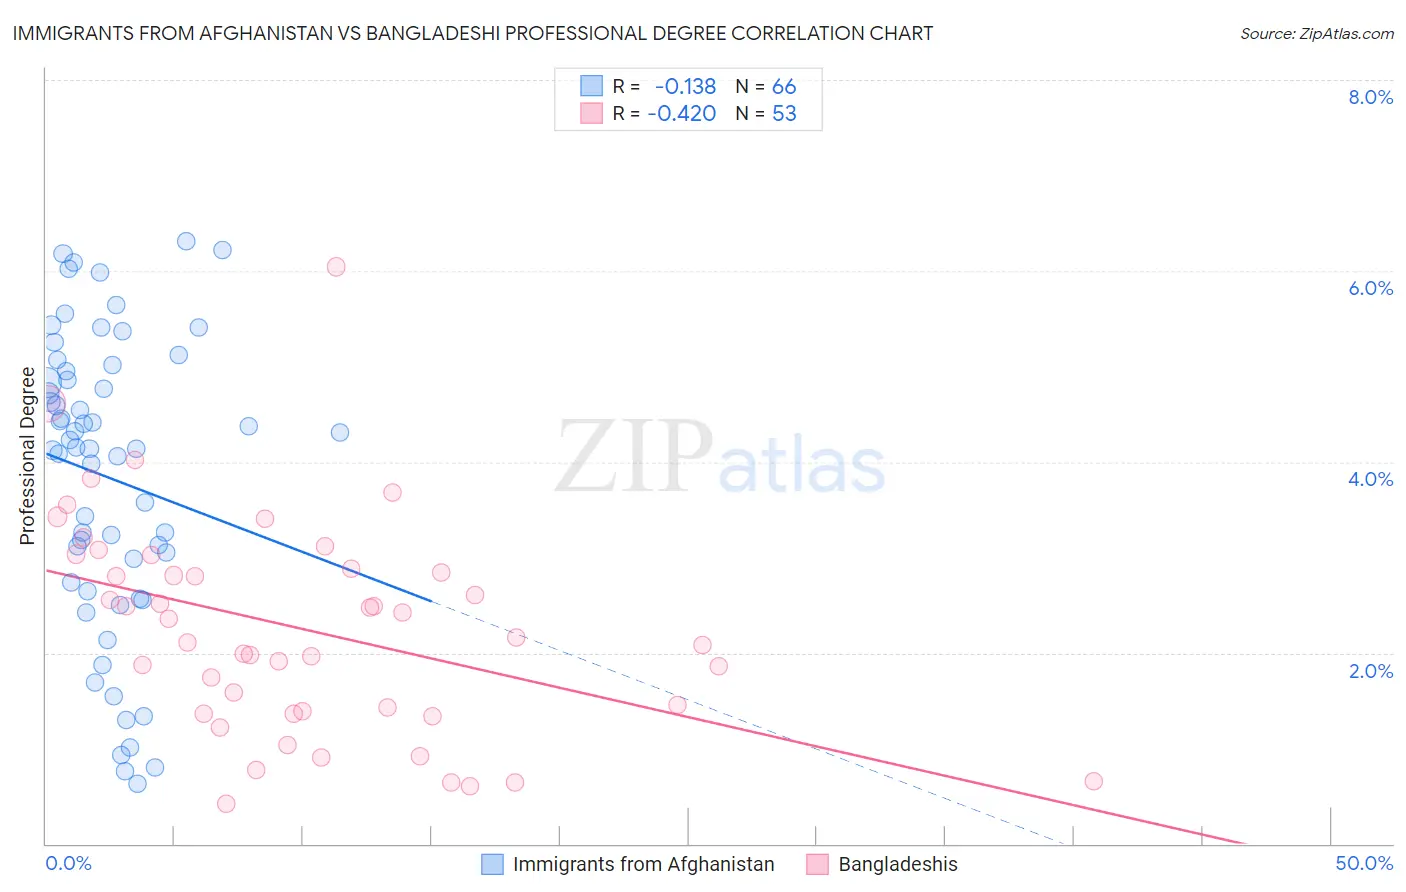
Immigrants from Afghanistan vs Bangladeshi Professional Degree Correlation Chart

The statistical analysis conducted on geographies consisting of 147,614,795 people shows a poor negative correlation between the proportion of Immigrants from Afghanistan and percentage of population with at least professional degree education in the United States with a correlation coefficient (R) of -0.138 and weighted average of 4.5%. Similarly, the statistical analysis conducted on geographies consisting of 141,225,031 people shows a moderate negative correlation between the proportion of Bangladeshis and percentage of population with at least professional degree education in the United States with a correlation coefficient (R) of -0.420 and weighted average of 3.1%, a difference of 44.6%.
Immigrants from Afghanistan vs Bangladeshi Professional Degree

Professional Degree Correlation Summary

MeasurementImmigrants from AfghanistanBangladeshi
Minimum0.62%0.42%
Maximum6.3%6.0%
Range5.7%5.6%
Mean3.8%2.3%
Median4.1%2.2%
Interquartile 25% (IQ1)2.7%1.4%
Interquartile 75% (IQ3)5.0%3.0%
Interquartile Range (IQR)2.2%1.6%
Standard Deviation (Sample)1.5%1.1%
Standard Deviation (Population)1.5%1.1%

Similar Demographics by Professional Degree

Demographics Similar to Immigrants from Afghanistan by Professional Degree

In terms of professional degree, the demographic groups most similar to Immigrants from Afghanistan are Immigrants from Colombia (4.5%, a difference of 0.030%), Immigrants from Sierra Leone (4.5%, a difference of 0.070%), Chinese (4.5%, a difference of 0.080%), Costa Rican (4.5%, a difference of 0.11%), and Immigrants from Zaire (4.5%, a difference of 0.26%).
DemographicsRating | RankProfessional Degree
Immigrants | Senegal
68.0
/100
|
#160
Good
4.5%
Assyrians/Chaldeans/Syriacs
67.4
/100
|
#161
Good
4.5%
Peruvians
65.2
/100
|
#162
Good
4.5%
Sierra Leoneans
64.3
/100
|
#163
Good
4.5%
Swiss
61.0
/100
|
#164
Good
4.5%
Costa Ricans
59.9
/100
|
#165
Average
4.5%
Immigrants | Colombia
59.4
/100
|
#166
Average
4.5%
Immigrants | Afghanistan
59.2
/100
|
#167
Average
4.5%
Immigrants | Sierra Leone
58.7
/100
|
#168
Average
4.5%
Chinese
58.6
/100
|
#169
Average
4.5%
Immigrants | Zaire
57.4
/100
|
#170
Average
4.5%
Immigrants | Bangladesh
56.0
/100
|
#171
Average
4.4%
Spaniards
52.0
/100
|
#172
Average
4.4%
English
50.1
/100
|
#173
Average
4.4%
Kenyans
50.0
/100
|
#174
Average
4.4%

Demographics Similar to Bangladeshis by Professional Degree

In terms of professional degree, the demographic groups most similar to Bangladeshis are Immigrants from Cabo Verde (3.1%, a difference of 0.080%), Kiowa (3.1%, a difference of 0.20%), Creek (3.1%, a difference of 0.21%), Dutch West Indian (3.1%, a difference of 0.27%), and Yakama (3.1%, a difference of 0.31%).
DemographicsRating | RankProfessional Degree
Hispanics or Latinos
0.0
/100
|
#322
Tragic
3.2%
Inupiat
0.0
/100
|
#323
Tragic
3.2%
Crow
0.0
/100
|
#324
Tragic
3.2%
Yaqui
0.0
/100
|
#325
Tragic
3.2%
Menominee
0.0
/100
|
#326
Tragic
3.1%
Dutch West Indians
0.0
/100
|
#327
Tragic
3.1%
Creek
0.0
/100
|
#328
Tragic
3.1%
Bangladeshis
0.0
/100
|
#329
Tragic
3.1%
Immigrants | Cabo Verde
0.0
/100
|
#330
Tragic
3.1%
Kiowa
0.0
/100
|
#331
Tragic
3.1%
Yakama
0.0
/100
|
#332
Tragic
3.1%
Puget Sound Salish
0.0
/100
|
#333
Tragic
3.1%
Pennsylvania Germans
0.0
/100
|
#334
Tragic
3.0%
Natives/Alaskans
0.0
/100
|
#335
Tragic
3.0%
Fijians
0.0
/100
|
#336
Tragic
2.9%