Houma vs Immigrants from Cambodia Professional Degree

COMPARE

Houma
Race
Ancestry
AfghanAfricanAlaska NativeAlaskan AthabascanAlbanianAleutAlsatianAmericanApacheArabArapahoArgentineanArmenianAssyrian/Chaldean/SyriacAustralianAustrianBahamianBangladeshiBarbadianBasqueBelgianBelizeanBermudanBhutaneseBlackfeetBolivianBrazilianBritishBritish West IndianBulgarianBurmeseCajunCambodianCanadianCape VerdeanCarpatho RusynCelticCentral AmericanCentral American IndianCherokeeCheyenneChickasawChileanChineseChippewaChoctawColombianColvilleComancheCosta RicanCreeCreekCroatianCrowCubanCypriotCzechCzechoslovakianDanishDelawareDominicanDutchDutch West IndianEastern EuropeanEcuadorianEgyptianEnglishEstonianEthiopianEuropeanFijianFilipinoFinnishFrenchFrench American IndianFrench CanadianGermanGerman RussianGhanaianGreekGuamanian/ChamorroGuatemalanGuyaneseHaitianHmongHonduranHopiHoumaHungarianIcelanderIndian (Asian)IndonesianInupiatIranianIraqiIrishIroquoisIsraeliItalianJamaicanJapaneseJordanianKenyanKiowaKoreanLaotianLatvianLebaneseLiberianLithuanianLumbeeLuxembourgerMacedonianMalaysianMalteseMarshalleseMenomineeMexicanMexican American IndianMongolianMoroccanNative HawaiianNavajoNepaleseNew ZealanderNicaraguanNigerianNorthern EuropeanNorwegianOkinawanOsageOttawaPaiutePakistaniPalestinianPanamanianParaguayanPennsylvania GermanPeruvianPimaPolishPortuguesePotawatomiPuebloPuerto RicanPuget Sound SalishRomanianRussianSalvadoranSamoanScandinavianScotch-IrishScottishSeminoleSenegaleseSerbianShoshoneSierra LeoneanSiouxSlavicSlovakSloveneSomaliSouth AfricanSouth AmericanSouth American IndianSoviet UnionSpaniardSpanishSpanish AmericanSpanish American IndianSri LankanSubsaharan AfricanSudaneseSwedishSwissSyrianTaiwaneseThaiTlingit-HaidaTohono O'OdhamTonganTrinidadian and TobagonianTsimshianTurkishU.S. Virgin IslanderUgandanUkrainianUruguayanUteVenezuelanVietnameseWelshWest IndianYakamaYaquiYugoslavianYumanYup'ikZimbabwean
Immigration
NonimmigrantsImmigrantsAfghanistanAfricaAlbaniaArgentinaArmeniaAsiaAustraliaAustriaBahamasBangladeshBarbadosBelarusBelgiumBelizeBoliviaBosnia and HerzegovinaBrazilBulgariaBurma/MyanmarCabo VerdeCameroonCanadaCaribbeanCentral AmericaChileChinaColombiaCongoCosta RicaCroatiaCubaCzechoslovakiaDenmarkDominicaDominican RepublicEastern AfricaEastern AsiaEastern EuropeEcuadorEgyptEl SalvadorEnglandEritreaEthiopiaEuropeFijiFranceGermanyGhanaGreeceGrenadaGuatemalaGuyanaHaitiHondurasHong KongHungaryIndiaIndonesiaIranIraqIrelandIsraelItalyJamaicaJapanJordanKazakhstanKenyaKoreaKuwaitLaosLatin AmericaLatviaLebanonLiberiaLithuaniaMalaysiaMexicoMicronesiaMiddle AfricaMoldovaMoroccoNepalNetherlandsNicaraguaNigeriaNorth AmericaNorth MacedoniaNorthern AfricaNorthern EuropeNorwayOceaniaPakistanPanamaPeruPhilippinesPolandPortugalRomaniaRussiaSaudi ArabiaScotlandSenegalSerbiaSierra LeoneSingaporeSomaliaSouth AfricaSouth AmericaSouth Central AsiaSouth Eastern AsiaSouthern EuropeSpainSri LankaSt. Vincent and the GrenadinesSudanSwedenSwitzerlandSyriaTaiwanThailandTrinidad and TobagoTurkeyUgandaUkraineUruguayUzbekistanVenezuelaVietnamWest IndiesWestern AfricaWestern AsiaWestern EuropeYemenZaireZimbabweAzores
Immigrants from Cambodia
Race
Ancestry
AfghanAfricanAlaska NativeAlaskan AthabascanAlbanianAleutAlsatianAmericanApacheArabArapahoArgentineanArmenianAssyrian/Chaldean/SyriacAustralianAustrianBahamianBangladeshiBarbadianBasqueBelgianBelizeanBermudanBhutaneseBlackfeetBolivianBrazilianBritishBritish West IndianBulgarianBurmeseCajunCambodianCanadianCape VerdeanCarpatho RusynCelticCentral AmericanCentral American IndianCherokeeCheyenneChickasawChileanChineseChippewaChoctawColombianColvilleComancheCosta RicanCreeCreekCroatianCrowCubanCypriotCzechCzechoslovakianDanishDelawareDominicanDutchDutch West IndianEastern EuropeanEcuadorianEgyptianEnglishEstonianEthiopianEuropeanFijianFilipinoFinnishFrenchFrench American IndianFrench CanadianGermanGerman RussianGhanaianGreekGuamanian/ChamorroGuatemalanGuyaneseHaitianHmongHonduranHopiHungarianIcelanderIndian (Asian)IndonesianInupiatIranianIraqiIrishIroquoisIsraeliItalianJamaicanJapaneseJordanianKenyanKiowaKoreanLaotianLatvianLebaneseLiberianLithuanianLumbeeLuxembourgerMacedonianMalaysianMalteseMarshalleseMenomineeMexicanMexican American IndianMongolianMoroccanNative HawaiianNavajoNepaleseNew ZealanderNicaraguanNigerianNorthern EuropeanNorwegianOkinawanOsageOttawaPaiutePakistaniPalestinianPanamanianParaguayanPennsylvania GermanPeruvianPimaPolishPortuguesePotawatomiPuebloPuerto RicanPuget Sound SalishRomanianRussianSalvadoranSamoanScandinavianScotch-IrishScottishSeminoleSenegaleseSerbianShoshoneSierra LeoneanSiouxSlavicSlovakSloveneSomaliSouth AfricanSouth AmericanSouth American IndianSoviet UnionSpaniardSpanishSpanish AmericanSpanish American IndianSri LankanSubsaharan AfricanSudaneseSwedishSwissSyrianTaiwaneseThaiTlingit-HaidaTohono O'OdhamTonganTrinidadian and TobagonianTsimshianTurkishU.S. Virgin IslanderUgandanUkrainianUruguayanUteVenezuelanVietnameseWelshWest IndianYakamaYaquiYugoslavianYumanYup'ikZimbabwean
Immigration
NonimmigrantsImmigrantsAfghanistanAfricaAlbaniaArgentinaArmeniaAsiaAustraliaAustriaBahamasBangladeshBarbadosBelarusBelgiumBelizeBoliviaBosnia and HerzegovinaBrazilBulgariaBurma/MyanmarCabo VerdeCambodiaCameroonCanadaCaribbeanCentral AmericaChileChinaColombiaCongoCosta RicaCroatiaCubaCzechoslovakiaDenmarkDominicaDominican RepublicEastern AfricaEastern AsiaEastern EuropeEcuadorEgyptEl SalvadorEnglandEritreaEthiopiaEuropeFijiFranceGermanyGhanaGreeceGrenadaGuatemalaGuyanaHaitiHondurasHong KongHungaryIndiaIndonesiaIranIraqIrelandIsraelItalyJamaicaJapanJordanKazakhstanKenyaKoreaKuwaitLaosLatin AmericaLatviaLebanonLiberiaLithuaniaMalaysiaMexicoMicronesiaMiddle AfricaMoldovaMoroccoNepalNetherlandsNicaraguaNigeriaNorth AmericaNorth MacedoniaNorthern AfricaNorthern EuropeNorwayOceaniaPakistanPanamaPeruPhilippinesPolandPortugalRomaniaRussiaSaudi ArabiaScotlandSenegalSerbiaSierra LeoneSingaporeSomaliaSouth AfricaSouth AmericaSouth Central AsiaSouth Eastern AsiaSouthern EuropeSpainSri LankaSt. Vincent and the GrenadinesSudanSwedenSwitzerlandSyriaTaiwanThailandTrinidad and TobagoTurkeyUgandaUkraineUruguayUzbekistanVenezuelaVietnamWest IndiesWestern AfricaWestern AsiaWestern EuropeYemenZaireZimbabweAzores
Professional Degree
Income
Poverty
Unemployment
Labor Participation
Family Structure
Vehicle Availability
Education Level
Disability

Professional Degree Comparison

Houma

Immigrants from Cambodia

Tragic
Tragic
2.2%
PROFESSIONAL DEGREE
0.0/ 100
METRIC RATING
347th/ 347
METRIC RANK
3.6%
PROFESSIONAL DEGREE
0.9/ 100
METRIC RATING
264th/ 347
METRIC RANK

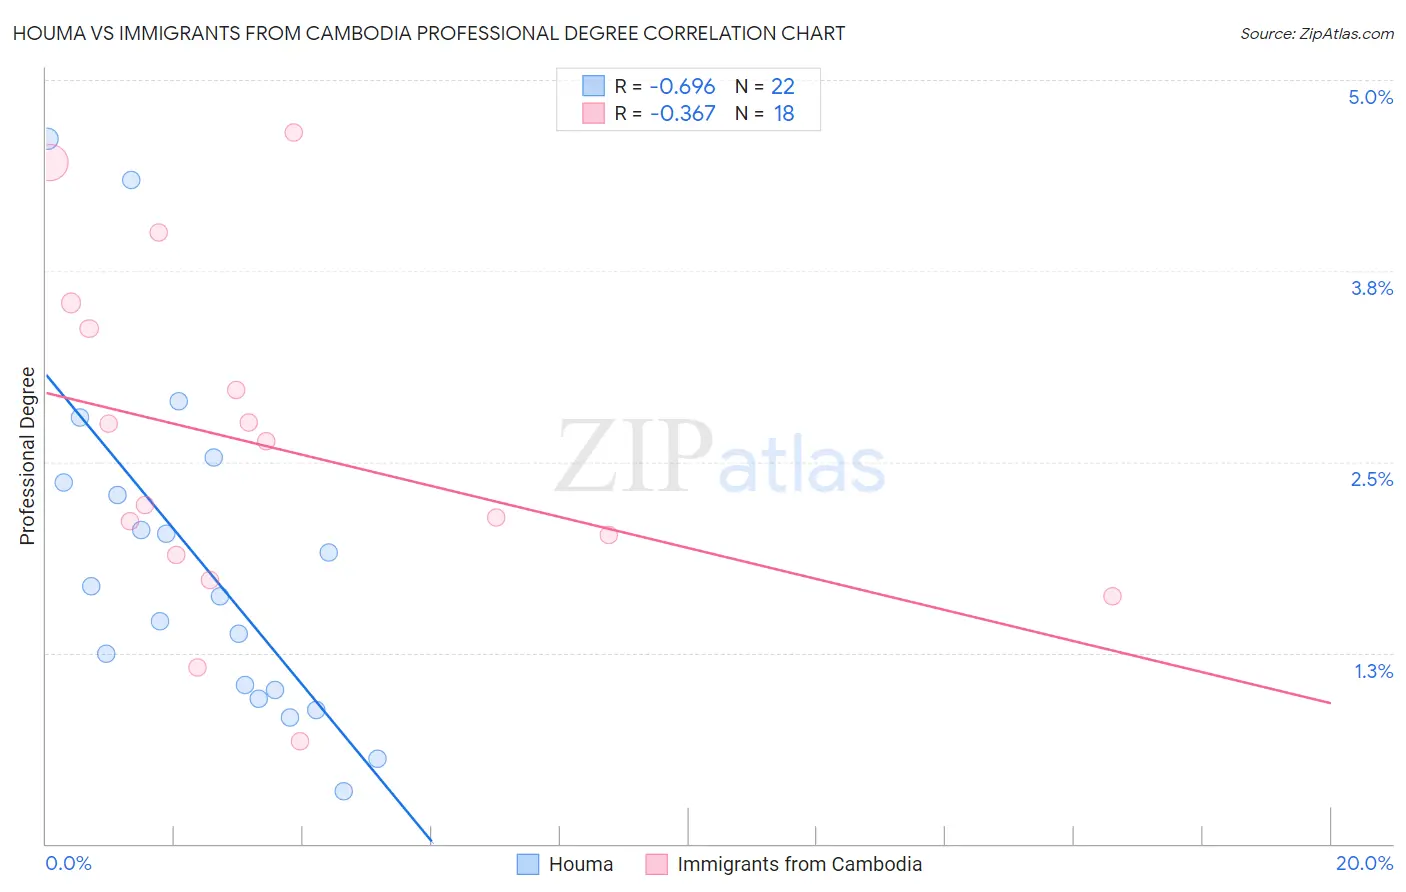
Houma vs Immigrants from Cambodia Professional Degree Correlation Chart

The statistical analysis conducted on geographies consisting of 36,689,629 people shows a significant negative correlation between the proportion of Houma and percentage of population with at least professional degree education in the United States with a correlation coefficient (R) of -0.696 and weighted average of 2.2%. Similarly, the statistical analysis conducted on geographies consisting of 205,005,692 people shows a mild negative correlation between the proportion of Immigrants from Cambodia and percentage of population with at least professional degree education in the United States with a correlation coefficient (R) of -0.367 and weighted average of 3.6%, a difference of 64.4%.
Houma vs Immigrants from Cambodia Professional Degree

Professional Degree Correlation Summary

MeasurementHoumaImmigrants from Cambodia
Minimum0.35%0.67%
Maximum4.6%4.7%
Range4.3%4.0%
Mean1.9%2.6%
Median1.7%2.4%
Interquartile 25% (IQ1)1.0%1.9%
Interquartile 75% (IQ3)2.4%3.4%
Interquartile Range (IQR)1.4%1.5%
Standard Deviation (Sample)1.1%1.1%
Standard Deviation (Population)1.1%1.1%

Similar Demographics by Professional Degree

Demographics Similar to Houma by Professional Degree

In terms of professional degree, the demographic groups most similar to Houma are Lumbee (2.5%, a difference of 11.1%), Immigrants from Mexico (2.6%, a difference of 19.3%), Spanish American Indian (2.7%, a difference of 19.7%), Mexican (2.7%, a difference of 24.0%), and Immigrants from the Azores (2.8%, a difference of 27.6%).
DemographicsRating | RankProfessional Degree
Puget Sound Salish
0.0
/100
|
#333
Tragic
3.1%
Pennsylvania Germans
0.0
/100
|
#334
Tragic
3.0%
Natives/Alaskans
0.0
/100
|
#335
Tragic
3.0%
Fijians
0.0
/100
|
#336
Tragic
2.9%
Arapaho
0.0
/100
|
#337
Tragic
2.9%
Navajo
0.0
/100
|
#338
Tragic
2.9%
Immigrants | Central America
0.0
/100
|
#339
Tragic
2.9%
Yup'ik
0.0
/100
|
#340
Tragic
2.9%
Tohono O'odham
0.0
/100
|
#341
Tragic
2.8%
Immigrants | Azores
0.0
/100
|
#342
Tragic
2.8%
Mexicans
0.0
/100
|
#343
Tragic
2.7%
Spanish American Indians
0.0
/100
|
#344
Tragic
2.7%
Immigrants | Mexico
0.0
/100
|
#345
Tragic
2.6%
Lumbee
0.0
/100
|
#346
Tragic
2.5%
Houma
0.0
/100
|
#347
Tragic
2.2%

Demographics Similar to Immigrants from Cambodia by Professional Degree

In terms of professional degree, the demographic groups most similar to Immigrants from Cambodia are Hopi (3.6%, a difference of 0.020%), Immigrants from Congo (3.6%, a difference of 0.040%), Central American Indian (3.6%, a difference of 0.36%), U.S. Virgin Islander (3.7%, a difference of 0.52%), and Immigrants from Guyana (3.7%, a difference of 0.53%).
DemographicsRating | RankProfessional Degree
Bahamians
1.1
/100
|
#257
Tragic
3.7%
Immigrants | St. Vincent and the Grenadines
1.1
/100
|
#258
Tragic
3.7%
Africans
1.0
/100
|
#259
Tragic
3.7%
Indonesians
1.0
/100
|
#260
Tragic
3.7%
Immigrants | Guyana
1.0
/100
|
#261
Tragic
3.7%
U.S. Virgin Islanders
1.0
/100
|
#262
Tragic
3.7%
Hopi
0.9
/100
|
#263
Tragic
3.6%
Immigrants | Cambodia
0.9
/100
|
#264
Tragic
3.6%
Immigrants | Congo
0.8
/100
|
#265
Tragic
3.6%
Central American Indians
0.8
/100
|
#266
Tragic
3.6%
Delaware
0.7
/100
|
#267
Tragic
3.6%
Aleuts
0.7
/100
|
#268
Tragic
3.6%
Immigrants | Cuba
0.6
/100
|
#269
Tragic
3.6%
Central Americans
0.6
/100
|
#270
Tragic
3.6%
Belizeans
0.5
/100
|
#271
Tragic
3.6%