Honduran vs Immigrants from Western Asia 11th Grade
COMPARE
Honduran
Immigrants from Western Asia
11th Grade
11th Grade Comparison
Hondurans
Immigrants from Western Asia
87.4%
11TH GRADE
0.0/ 100
METRIC RATING
330th/ 347
METRIC RANK
92.4%
11TH GRADE
35.0/ 100
METRIC RATING
187th/ 347
METRIC RANK
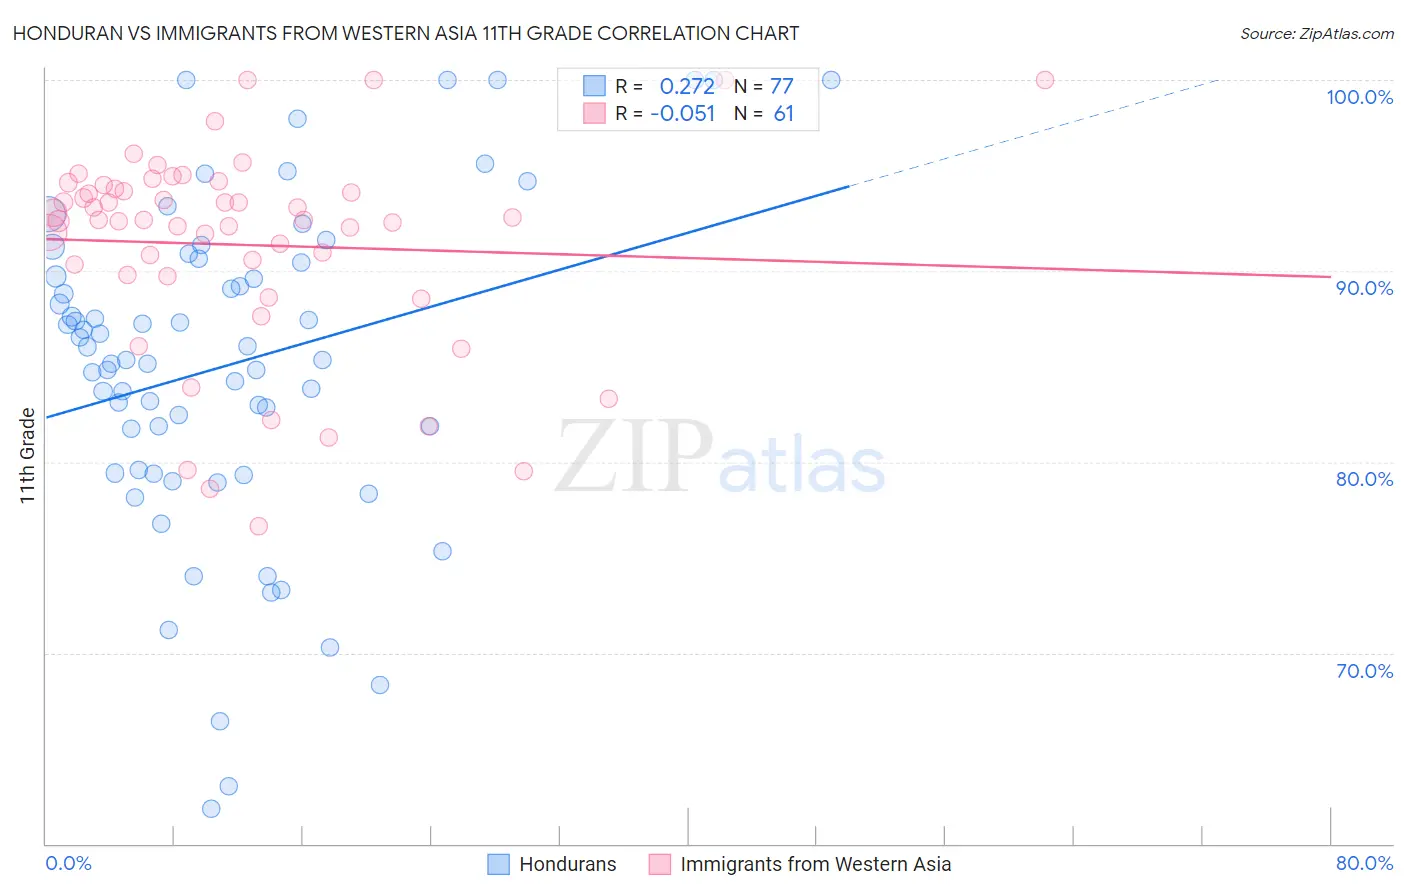
Honduran vs Immigrants from Western Asia 11th Grade Correlation Chart
The statistical analysis conducted on geographies consisting of 357,858,827 people shows a weak positive correlation between the proportion of Hondurans and percentage of population with at least 11th grade education in the United States with a correlation coefficient (R) of 0.272 and weighted average of 87.4%. Similarly, the statistical analysis conducted on geographies consisting of 404,433,811 people shows a slight negative correlation between the proportion of Immigrants from Western Asia and percentage of population with at least 11th grade education in the United States with a correlation coefficient (R) of -0.051 and weighted average of 92.4%, a difference of 5.7%.
11th Grade Correlation Summary
| Measurement | Honduran | Immigrants from Western Asia |
| Minimum | 61.9% | 76.6% |
| Maximum | 100.0% | 100.0% |
| Range | 38.1% | 23.4% |
| Mean | 85.1% | 91.4% |
| Median | 85.4% | 92.6% |
| Interquartile 25% (IQ1) | 79.5% | 89.8% |
| Interquartile 75% (IQ3) | 90.5% | 94.4% |
| Interquartile Range (IQR) | 11.0% | 4.6% |
| Standard Deviation (Sample) | 8.6% | 5.4% |
| Standard Deviation (Population) | 8.5% | 5.3% |
Similar Demographics by 11th Grade
Demographics Similar to Hondurans by 11th Grade
In terms of 11th grade, the demographic groups most similar to Hondurans are Hispanic or Latino (87.3%, a difference of 0.060%), Immigrants from the Azores (87.2%, a difference of 0.16%), Mexican American Indian (87.5%, a difference of 0.19%), Tohono O'odham (87.6%, a difference of 0.26%), and Immigrants from Cabo Verde (87.6%, a difference of 0.31%).
| Demographics | Rating | Rank | 11th Grade |
| Pima | 0.0 /100 | #323 | Tragic 88.3% |
| Central American Indians | 0.0 /100 | #324 | Tragic 88.2% |
| Immigrants | Nicaragua | 0.0 /100 | #325 | Tragic 88.1% |
| Dominicans | 0.0 /100 | #326 | Tragic 87.7% |
| Immigrants | Cabo Verde | 0.0 /100 | #327 | Tragic 87.6% |
| Tohono O'odham | 0.0 /100 | #328 | Tragic 87.6% |
| Mexican American Indians | 0.0 /100 | #329 | Tragic 87.5% |
| Hondurans | 0.0 /100 | #330 | Tragic 87.4% |
| Hispanics or Latinos | 0.0 /100 | #331 | Tragic 87.3% |
| Immigrants | Azores | 0.0 /100 | #332 | Tragic 87.2% |
| Immigrants | Yemen | 0.0 /100 | #333 | Tragic 87.1% |
| Houma | 0.0 /100 | #334 | Tragic 87.0% |
| Central Americans | 0.0 /100 | #335 | Tragic 86.9% |
| Immigrants | Dominican Republic | 0.0 /100 | #336 | Tragic 86.9% |
| Immigrants | Honduras | 0.0 /100 | #337 | Tragic 86.9% |
Demographics Similar to Immigrants from Western Asia by 11th Grade
In terms of 11th grade, the demographic groups most similar to Immigrants from Western Asia are Arapaho (92.4%, a difference of 0.0%), Immigrants from Indonesia (92.4%, a difference of 0.010%), Immigrants from Nepal (92.4%, a difference of 0.020%), Immigrants from Chile (92.4%, a difference of 0.020%), and Immigrants from Malaysia (92.4%, a difference of 0.030%).
| Demographics | Rating | Rank | 11th Grade |
| Inupiat | 40.7 /100 | #180 | Average 92.4% |
| Cherokee | 40.7 /100 | #181 | Average 92.4% |
| Immigrants | Morocco | 38.6 /100 | #182 | Fair 92.4% |
| Immigrants | Malaysia | 37.6 /100 | #183 | Fair 92.4% |
| Immigrants | Asia | 37.4 /100 | #184 | Fair 92.4% |
| Immigrants | Nepal | 36.4 /100 | #185 | Fair 92.4% |
| Arapaho | 35.1 /100 | #186 | Fair 92.4% |
| Immigrants | Western Asia | 35.0 /100 | #187 | Fair 92.4% |
| Immigrants | Indonesia | 33.7 /100 | #188 | Fair 92.4% |
| Immigrants | Chile | 33.3 /100 | #189 | Fair 92.4% |
| Chickasaw | 31.4 /100 | #190 | Fair 92.3% |
| French American Indians | 30.8 /100 | #191 | Fair 92.3% |
| Immigrants | Syria | 30.4 /100 | #192 | Fair 92.3% |
| Moroccans | 28.7 /100 | #193 | Fair 92.3% |
| Sioux | 28.5 /100 | #194 | Fair 92.3% |