Honduran vs Immigrants from Sierra Leone Associate's Degree
COMPARE
Honduran
Immigrants from Sierra Leone
Associate's Degree
Associate's Degree Comparison
Hondurans
Immigrants from Sierra Leone
38.9%
ASSOCIATE'S DEGREE
0.0/ 100
METRIC RATING
295th/ 347
METRIC RANK
46.7%
ASSOCIATE'S DEGREE
59.2/ 100
METRIC RATING
167th/ 347
METRIC RANK
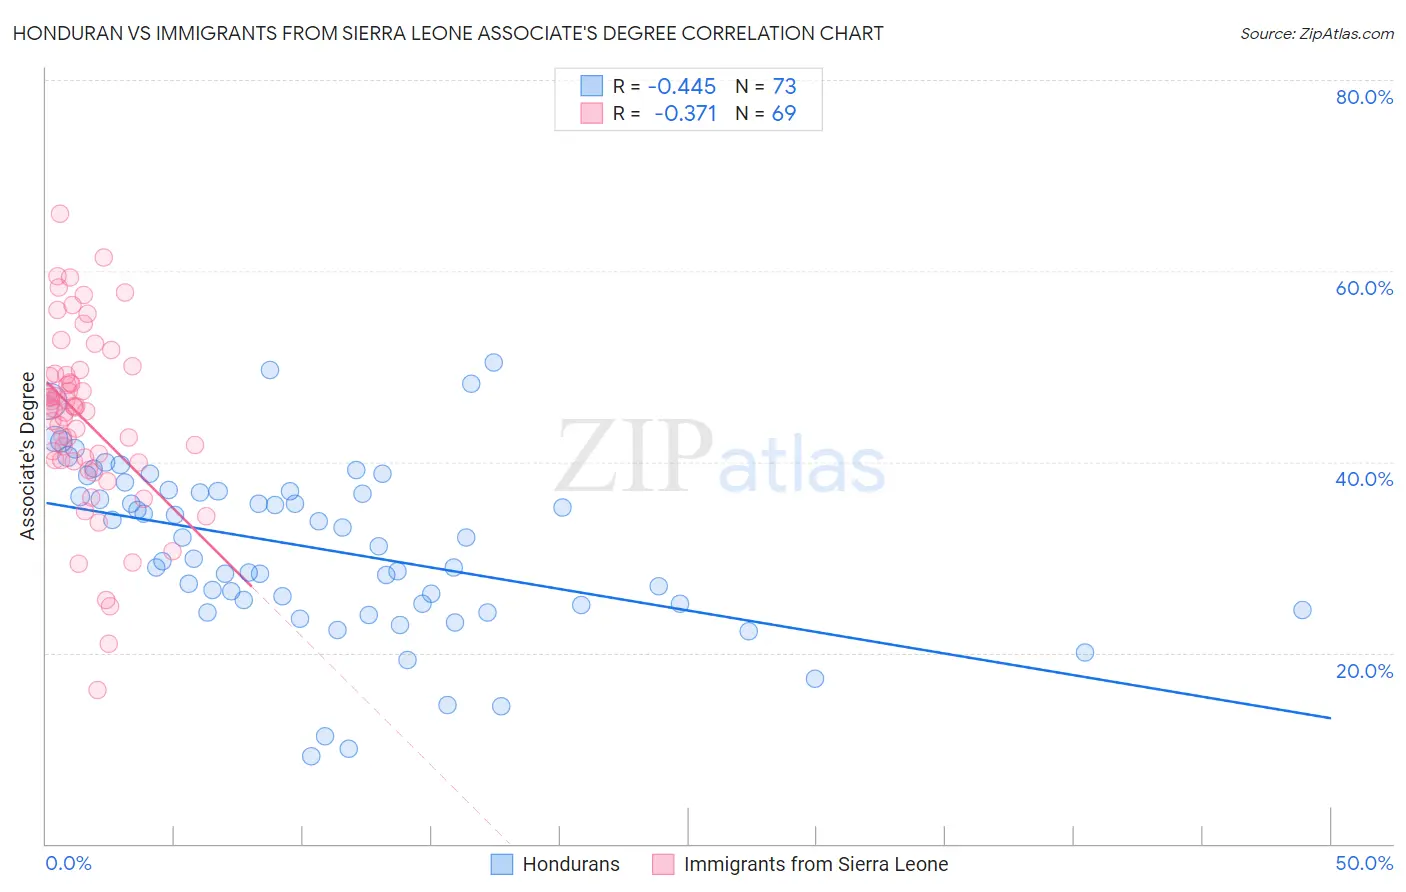
Honduran vs Immigrants from Sierra Leone Associate's Degree Correlation Chart
The statistical analysis conducted on geographies consisting of 357,791,704 people shows a moderate negative correlation between the proportion of Hondurans and percentage of population with at least associate's degree education in the United States with a correlation coefficient (R) of -0.445 and weighted average of 38.9%. Similarly, the statistical analysis conducted on geographies consisting of 101,624,736 people shows a mild negative correlation between the proportion of Immigrants from Sierra Leone and percentage of population with at least associate's degree education in the United States with a correlation coefficient (R) of -0.371 and weighted average of 46.7%, a difference of 19.9%.
Associate's Degree Correlation Summary
| Measurement | Honduran | Immigrants from Sierra Leone |
| Minimum | 9.2% | 16.1% |
| Maximum | 50.4% | 66.0% |
| Range | 41.1% | 50.0% |
| Mean | 30.9% | 44.5% |
| Median | 31.2% | 45.7% |
| Interquartile 25% (IQ1) | 25.1% | 40.1% |
| Interquartile 75% (IQ3) | 36.9% | 49.2% |
| Interquartile Range (IQR) | 11.9% | 9.1% |
| Standard Deviation (Sample) | 8.9% | 9.5% |
| Standard Deviation (Population) | 8.9% | 9.4% |
Similar Demographics by Associate's Degree
Demographics Similar to Hondurans by Associate's Degree
In terms of associate's degree, the demographic groups most similar to Hondurans are Cherokee (38.9%, a difference of 0.17%), Nepalese (39.0%, a difference of 0.29%), Salvadoran (39.0%, a difference of 0.29%), Cape Verdean (38.8%, a difference of 0.45%), and Black/African American (39.1%, a difference of 0.54%).
| Demographics | Rating | Rank | Associate's Degree |
| Immigrants | Cuba | 0.0 /100 | #288 | Tragic 39.5% |
| Central Americans | 0.0 /100 | #289 | Tragic 39.4% |
| Immigrants | Haiti | 0.0 /100 | #290 | Tragic 39.3% |
| Dominicans | 0.0 /100 | #291 | Tragic 39.3% |
| Blacks/African Americans | 0.0 /100 | #292 | Tragic 39.1% |
| Nepalese | 0.0 /100 | #293 | Tragic 39.0% |
| Salvadorans | 0.0 /100 | #294 | Tragic 39.0% |
| Hondurans | 0.0 /100 | #295 | Tragic 38.9% |
| Cherokee | 0.0 /100 | #296 | Tragic 38.9% |
| Cape Verdeans | 0.0 /100 | #297 | Tragic 38.8% |
| Cheyenne | 0.0 /100 | #298 | Tragic 38.7% |
| Ute | 0.0 /100 | #299 | Tragic 38.6% |
| Chickasaw | 0.0 /100 | #300 | Tragic 38.6% |
| Tsimshian | 0.0 /100 | #301 | Tragic 38.6% |
| Colville | 0.0 /100 | #302 | Tragic 38.5% |
Demographics Similar to Immigrants from Sierra Leone by Associate's Degree
In terms of associate's degree, the demographic groups most similar to Immigrants from Sierra Leone are Hungarian (46.7%, a difference of 0.010%), Immigrants from South America (46.7%, a difference of 0.050%), Colombian (46.8%, a difference of 0.25%), Somali (46.8%, a difference of 0.26%), and Immigrants from Somalia (46.5%, a difference of 0.29%).
| Demographics | Rating | Rank | Associate's Degree |
| Scottish | 65.4 /100 | #160 | Good 46.9% |
| Scandinavians | 65.2 /100 | #161 | Good 46.9% |
| Immigrants | Africa | 63.2 /100 | #162 | Good 46.8% |
| Somalis | 62.5 /100 | #163 | Good 46.8% |
| Colombians | 62.4 /100 | #164 | Good 46.8% |
| Immigrants | South America | 59.9 /100 | #165 | Average 46.7% |
| Hungarians | 59.3 /100 | #166 | Average 46.7% |
| Immigrants | Sierra Leone | 59.2 /100 | #167 | Average 46.7% |
| Immigrants | Somalia | 55.5 /100 | #168 | Average 46.5% |
| Uruguayans | 55.4 /100 | #169 | Average 46.5% |
| Irish | 53.6 /100 | #170 | Average 46.5% |
| Basques | 52.8 /100 | #171 | Average 46.5% |
| Peruvians | 50.5 /100 | #172 | Average 46.4% |
| Immigrants | Iraq | 50.3 /100 | #173 | Average 46.4% |
| English | 50.0 /100 | #174 | Average 46.4% |