Hmong vs Sri Lankan 10th Grade
COMPARE
Hmong
Sri Lankan
10th Grade
10th Grade Comparison
Hmong
Sri Lankans
94.1%
10TH GRADE
86.6/ 100
METRIC RATING
141st/ 347
METRIC RANK
91.8%
10TH GRADE
0.0/ 100
METRIC RATING
289th/ 347
METRIC RANK
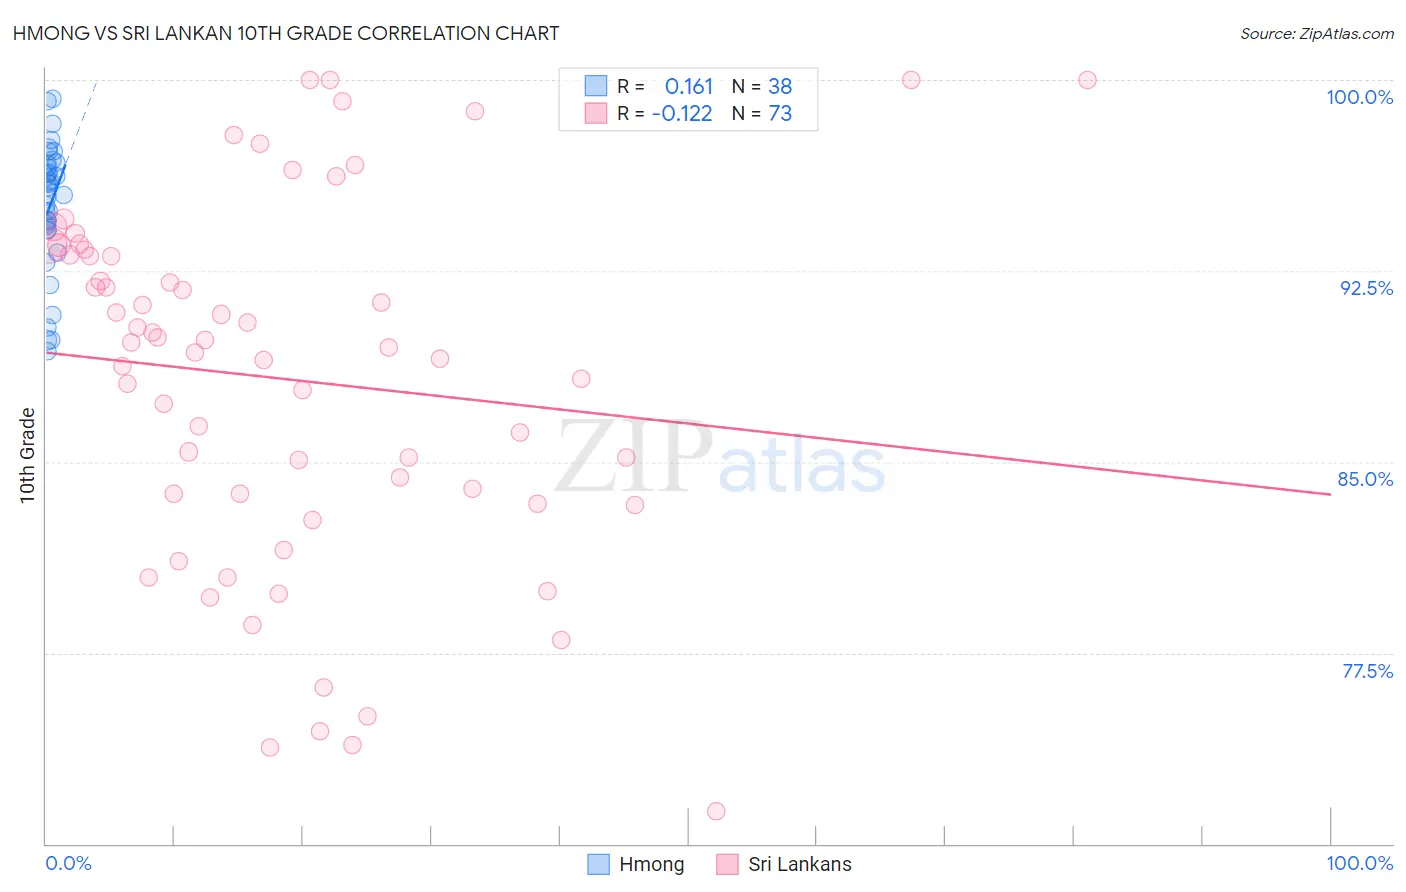
Hmong vs Sri Lankan 10th Grade Correlation Chart
The statistical analysis conducted on geographies consisting of 24,672,093 people shows a poor positive correlation between the proportion of Hmong and percentage of population with at least 10th grade education in the United States with a correlation coefficient (R) of 0.161 and weighted average of 94.1%. Similarly, the statistical analysis conducted on geographies consisting of 440,593,537 people shows a poor negative correlation between the proportion of Sri Lankans and percentage of population with at least 10th grade education in the United States with a correlation coefficient (R) of -0.122 and weighted average of 91.8%, a difference of 2.5%.
10th Grade Correlation Summary
| Measurement | Hmong | Sri Lankan |
| Minimum | 89.3% | 71.3% |
| Maximum | 99.2% | 100.0% |
| Range | 9.9% | 28.7% |
| Mean | 95.0% | 88.2% |
| Median | 95.6% | 89.5% |
| Interquartile 25% (IQ1) | 94.1% | 83.6% |
| Interquartile 75% (IQ3) | 96.7% | 93.2% |
| Interquartile Range (IQR) | 2.6% | 9.7% |
| Standard Deviation (Sample) | 2.5% | 7.1% |
| Standard Deviation (Population) | 2.5% | 7.0% |
Similar Demographics by 10th Grade
Demographics Similar to Hmong by 10th Grade
In terms of 10th grade, the demographic groups most similar to Hmong are Albanian (94.1%, a difference of 0.0%), Immigrants from Jordan (94.1%, a difference of 0.020%), Cherokee (94.1%, a difference of 0.030%), Immigrants from Kazakhstan (94.1%, a difference of 0.030%), and Nonimmigrants (94.1%, a difference of 0.050%).
| Demographics | Rating | Rank | 10th Grade |
| Osage | 91.7 /100 | #134 | Exceptional 94.2% |
| Immigrants | Korea | 91.3 /100 | #135 | Exceptional 94.2% |
| Shoshone | 90.8 /100 | #136 | Exceptional 94.2% |
| Arapaho | 90.5 /100 | #137 | Exceptional 94.2% |
| Immigrants | Sri Lanka | 89.9 /100 | #138 | Excellent 94.2% |
| Immigrants | Bosnia and Herzegovina | 89.4 /100 | #139 | Excellent 94.2% |
| Immigrants | Jordan | 87.6 /100 | #140 | Excellent 94.1% |
| Hmong | 86.6 /100 | #141 | Excellent 94.1% |
| Albanians | 86.5 /100 | #142 | Excellent 94.1% |
| Cherokee | 84.9 /100 | #143 | Excellent 94.1% |
| Immigrants | Kazakhstan | 84.9 /100 | #144 | Excellent 94.1% |
| Immigrants | Nonimmigrants | 83.8 /100 | #145 | Excellent 94.1% |
| Chickasaw | 82.6 /100 | #146 | Excellent 94.1% |
| Immigrants | Ukraine | 81.5 /100 | #147 | Excellent 94.0% |
| Arabs | 80.9 /100 | #148 | Excellent 94.0% |
Demographics Similar to Sri Lankans by 10th Grade
In terms of 10th grade, the demographic groups most similar to Sri Lankans are British West Indian (91.8%, a difference of 0.020%), Immigrants from West Indies (91.8%, a difference of 0.030%), Immigrants from Burma/Myanmar (91.8%, a difference of 0.030%), Pennsylvania German (91.9%, a difference of 0.040%), and Immigrants from Laos (91.9%, a difference of 0.040%).
| Demographics | Rating | Rank | 10th Grade |
| Immigrants | Peru | 0.1 /100 | #282 | Tragic 92.2% |
| Immigrants | St. Vincent and the Grenadines | 0.0 /100 | #283 | Tragic 92.1% |
| Immigrants | Barbados | 0.0 /100 | #284 | Tragic 92.1% |
| Immigrants | South Eastern Asia | 0.0 /100 | #285 | Tragic 92.1% |
| Yuman | 0.0 /100 | #286 | Tragic 92.0% |
| Pennsylvania Germans | 0.0 /100 | #287 | Tragic 91.9% |
| Immigrants | Laos | 0.0 /100 | #288 | Tragic 91.9% |
| Sri Lankans | 0.0 /100 | #289 | Tragic 91.8% |
| British West Indians | 0.0 /100 | #290 | Tragic 91.8% |
| Immigrants | West Indies | 0.0 /100 | #291 | Tragic 91.8% |
| Immigrants | Burma/Myanmar | 0.0 /100 | #292 | Tragic 91.8% |
| Indonesians | 0.0 /100 | #293 | Tragic 91.8% |
| Haitians | 0.0 /100 | #294 | Tragic 91.8% |
| Lumbee | 0.0 /100 | #295 | Tragic 91.7% |
| Immigrants | Grenada | 0.0 /100 | #296 | Tragic 91.6% |