Hispanic or Latino vs Immigrants from Kazakhstan 2nd Grade
COMPARE
Hispanic or Latino
Immigrants from Kazakhstan
2nd Grade
2nd Grade Comparison
Hispanics or Latinos
Immigrants from Kazakhstan
96.8%
2ND GRADE
0.0/ 100
METRIC RATING
313th/ 347
METRIC RANK
97.8%
2ND GRADE
35.6/ 100
METRIC RATING
188th/ 347
METRIC RANK
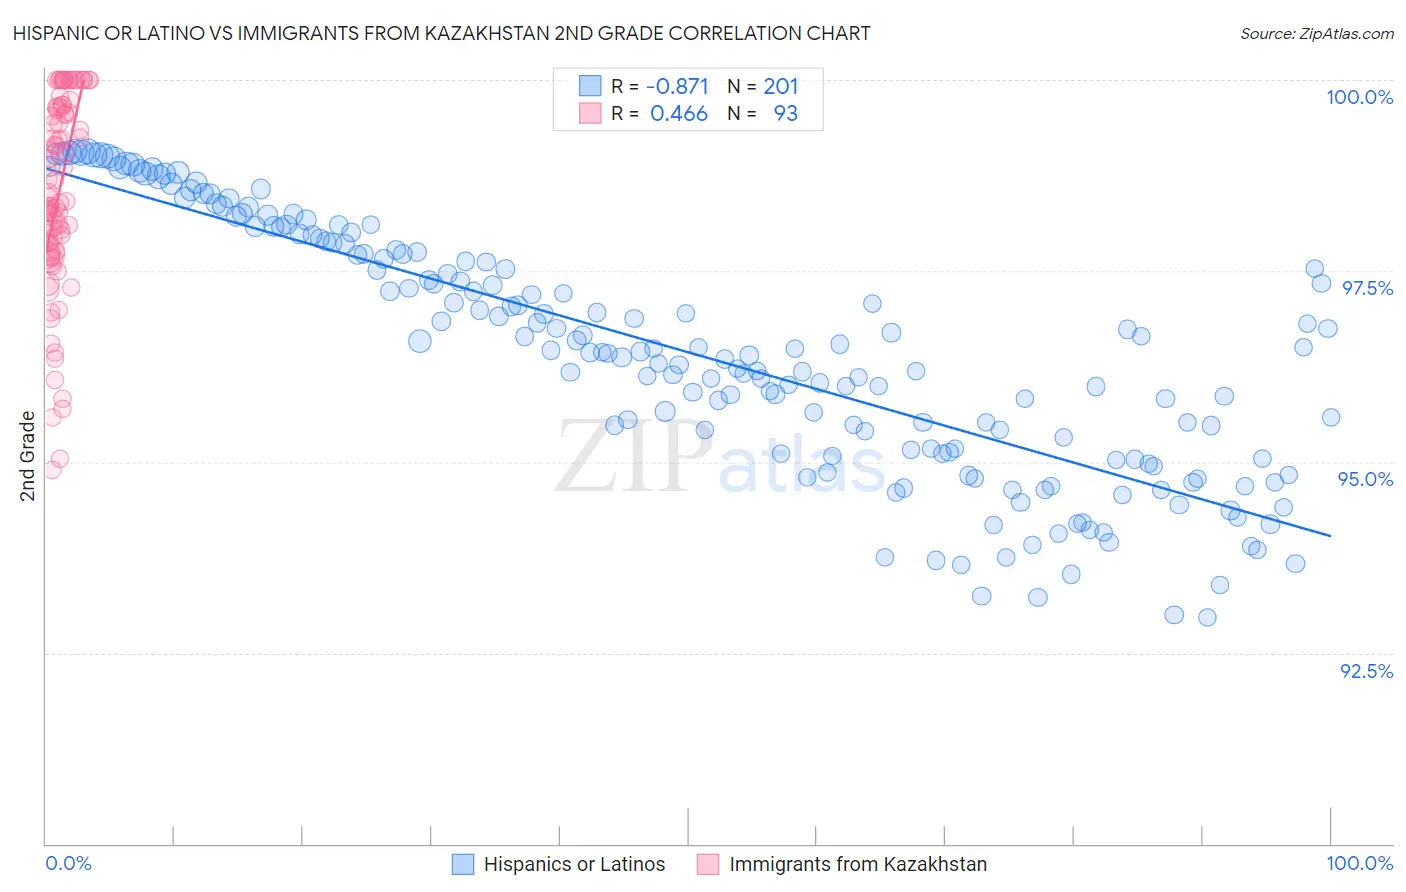
Hispanic or Latino vs Immigrants from Kazakhstan 2nd Grade Correlation Chart
The statistical analysis conducted on geographies consisting of 578,615,396 people shows a very strong negative correlation between the proportion of Hispanics or Latinos and percentage of population with at least 2nd grade education in the United States with a correlation coefficient (R) of -0.871 and weighted average of 96.8%. Similarly, the statistical analysis conducted on geographies consisting of 124,444,388 people shows a moderate positive correlation between the proportion of Immigrants from Kazakhstan and percentage of population with at least 2nd grade education in the United States with a correlation coefficient (R) of 0.466 and weighted average of 97.8%, a difference of 1.1%.
2nd Grade Correlation Summary
| Measurement | Hispanic or Latino | Immigrants from Kazakhstan |
| Minimum | 93.0% | 94.9% |
| Maximum | 99.1% | 100.0% |
| Range | 6.1% | 5.1% |
| Mean | 96.4% | 98.5% |
| Median | 96.4% | 98.5% |
| Interquartile 25% (IQ1) | 95.1% | 97.8% |
| Interquartile 75% (IQ3) | 97.8% | 99.6% |
| Interquartile Range (IQR) | 2.6% | 1.9% |
| Standard Deviation (Sample) | 1.6% | 1.3% |
| Standard Deviation (Population) | 1.6% | 1.3% |
Similar Demographics by 2nd Grade
Demographics Similar to Hispanics or Latinos by 2nd Grade
In terms of 2nd grade, the demographic groups most similar to Hispanics or Latinos are Cape Verdean (96.8%, a difference of 0.020%), Sri Lankan (96.8%, a difference of 0.030%), Guyanese (96.8%, a difference of 0.030%), Immigrants from Ecuador (96.8%, a difference of 0.030%), and Immigrants from Haiti (96.8%, a difference of 0.040%).
| Demographics | Rating | Rank | 2nd Grade |
| Immigrants | Somalia | 0.0 /100 | #306 | Tragic 96.9% |
| Immigrants | Azores | 0.0 /100 | #307 | Tragic 96.8% |
| Immigrants | Haiti | 0.0 /100 | #308 | Tragic 96.8% |
| Belizeans | 0.0 /100 | #309 | Tragic 96.8% |
| Sri Lankans | 0.0 /100 | #310 | Tragic 96.8% |
| Guyanese | 0.0 /100 | #311 | Tragic 96.8% |
| Cape Verdeans | 0.0 /100 | #312 | Tragic 96.8% |
| Hispanics or Latinos | 0.0 /100 | #313 | Tragic 96.8% |
| Immigrants | Ecuador | 0.0 /100 | #314 | Tragic 96.8% |
| Immigrants | Belize | 0.0 /100 | #315 | Tragic 96.8% |
| Hondurans | 0.0 /100 | #316 | Tragic 96.7% |
| Immigrants | Laos | 0.0 /100 | #317 | Tragic 96.7% |
| Indonesians | 0.0 /100 | #318 | Tragic 96.7% |
| Immigrants | Nicaragua | 0.0 /100 | #319 | Tragic 96.7% |
| Immigrants | Guyana | 0.0 /100 | #320 | Tragic 96.7% |
Demographics Similar to Immigrants from Kazakhstan by 2nd Grade
In terms of 2nd grade, the demographic groups most similar to Immigrants from Kazakhstan are Arab (97.8%, a difference of 0.0%), Pakistani (97.8%, a difference of 0.0%), Panamanian (97.8%, a difference of 0.010%), Immigrants from Taiwan (97.8%, a difference of 0.010%), and Portuguese (97.8%, a difference of 0.020%).
| Demographics | Rating | Rank | 2nd Grade |
| Egyptians | 44.3 /100 | #181 | Average 97.9% |
| Portuguese | 42.4 /100 | #182 | Average 97.8% |
| Immigrants | Poland | 42.2 /100 | #183 | Average 97.8% |
| Immigrants | Belarus | 41.5 /100 | #184 | Average 97.8% |
| Immigrants | Argentina | 40.6 /100 | #185 | Average 97.8% |
| Arabs | 36.9 /100 | #186 | Fair 97.8% |
| Pakistanis | 36.1 /100 | #187 | Fair 97.8% |
| Immigrants | Kazakhstan | 35.6 /100 | #188 | Fair 97.8% |
| Panamanians | 33.5 /100 | #189 | Fair 97.8% |
| Immigrants | Taiwan | 31.8 /100 | #190 | Fair 97.8% |
| Paraguayans | 30.8 /100 | #191 | Fair 97.8% |
| Blacks/African Americans | 29.9 /100 | #192 | Fair 97.8% |
| Hawaiians | 28.5 /100 | #193 | Fair 97.8% |
| Paiute | 27.0 /100 | #194 | Fair 97.8% |
| Mongolians | 26.7 /100 | #195 | Fair 97.8% |