Hispanic or Latino vs Immigrants from Iran 12th Grade, No Diploma

COMPARE

Hispanic or Latino
Race
Ancestry
AfghanAfricanAlaska NativeAlaskan AthabascanAlbanianAleutAlsatianAmericanApacheArabArapahoArgentineanArmenianAssyrian/Chaldean/SyriacAustralianAustrianBahamianBangladeshiBarbadianBasqueBelgianBelizeanBermudanBhutaneseBlackfeetBolivianBrazilianBritishBritish West IndianBulgarianBurmeseCajunCambodianCanadianCape VerdeanCarpatho RusynCelticCentral AmericanCentral American IndianCherokeeCheyenneChickasawChileanChineseChippewaChoctawColombianColvilleComancheCosta RicanCreeCreekCroatianCrowCubanCypriotCzechCzechoslovakianDanishDelawareDominicanDutchDutch West IndianEastern EuropeanEcuadorianEgyptianEnglishEstonianEthiopianEuropeanFijianFilipinoFinnishFrenchFrench American IndianFrench CanadianGermanGerman RussianGhanaianGreekGuamanian/ChamorroGuatemalanGuyaneseHaitianHmongHonduranHopiHoumaHungarianIcelanderIndian (Asian)IndonesianInupiatIranianIraqiIrishIroquoisIsraeliItalianJamaicanJapaneseJordanianKenyanKiowaKoreanLaotianLatvianLebaneseLiberianLithuanianLumbeeLuxembourgerMacedonianMalaysianMalteseMarshalleseMenomineeMexicanMexican American IndianMongolianMoroccanNative HawaiianNavajoNepaleseNew ZealanderNicaraguanNigerianNorthern EuropeanNorwegianOkinawanOsageOttawaPaiutePakistaniPalestinianPanamanianParaguayanPennsylvania GermanPeruvianPimaPolishPortuguesePotawatomiPuebloPuerto RicanPuget Sound SalishRomanianRussianSalvadoranSamoanScandinavianScotch-IrishScottishSeminoleSenegaleseSerbianShoshoneSierra LeoneanSiouxSlavicSlovakSloveneSomaliSouth AfricanSouth AmericanSouth American IndianSoviet UnionSpaniardSpanishSpanish AmericanSpanish American IndianSri LankanSubsaharan AfricanSudaneseSwedishSwissSyrianTaiwaneseThaiTlingit-HaidaTohono O'OdhamTonganTrinidadian and TobagonianTsimshianTurkishU.S. Virgin IslanderUgandanUkrainianUruguayanUteVenezuelanVietnameseWelshWest IndianYakamaYaquiYugoslavianYumanYup'ikZimbabwean
Immigration
NonimmigrantsImmigrantsAfghanistanAfricaAlbaniaArgentinaArmeniaAsiaAustraliaAustriaBahamasBangladeshBarbadosBelarusBelgiumBelizeBoliviaBosnia and HerzegovinaBrazilBulgariaBurma/MyanmarCabo VerdeCambodiaCameroonCanadaCaribbeanCentral AmericaChileChinaColombiaCongoCosta RicaCroatiaCubaCzechoslovakiaDenmarkDominicaDominican RepublicEastern AfricaEastern AsiaEastern EuropeEcuadorEgyptEl SalvadorEnglandEritreaEthiopiaEuropeFijiFranceGermanyGhanaGreeceGrenadaGuatemalaGuyanaHaitiHondurasHong KongHungaryIndiaIndonesiaIraqIrelandIsraelItalyJamaicaJapanJordanKazakhstanKenyaKoreaKuwaitLaosLatin AmericaLatviaLebanonLiberiaLithuaniaMalaysiaMexicoMicronesiaMiddle AfricaMoldovaMoroccoNepalNetherlandsNicaraguaNigeriaNorth AmericaNorth MacedoniaNorthern AfricaNorthern EuropeNorwayOceaniaPakistanPanamaPeruPhilippinesPolandPortugalRomaniaRussiaSaudi ArabiaScotlandSenegalSerbiaSierra LeoneSingaporeSomaliaSouth AfricaSouth AmericaSouth Central AsiaSouth Eastern AsiaSouthern EuropeSpainSri LankaSt. Vincent and the GrenadinesSudanSwedenSwitzerlandSyriaTaiwanThailandTrinidad and TobagoTurkeyUgandaUkraineUruguayUzbekistanVenezuelaVietnamWest IndiesWestern AfricaWestern AsiaWestern EuropeYemenZaireZimbabweAzores
Immigrants from Iran
Race
Ancestry
AfghanAfricanAlaska NativeAlaskan AthabascanAlbanianAleutAlsatianAmericanApacheArabArapahoArgentineanArmenianAssyrian/Chaldean/SyriacAustralianAustrianBahamianBangladeshiBarbadianBasqueBelgianBelizeanBermudanBhutaneseBlackfeetBolivianBrazilianBritishBritish West IndianBulgarianBurmeseCajunCambodianCanadianCape VerdeanCarpatho RusynCelticCentral AmericanCentral American IndianCherokeeCheyenneChickasawChileanChineseChippewaChoctawColombianColvilleComancheCosta RicanCreeCreekCroatianCrowCubanCypriotCzechCzechoslovakianDanishDelawareDominicanDutchDutch West IndianEastern EuropeanEcuadorianEgyptianEnglishEstonianEthiopianEuropeanFijianFilipinoFinnishFrenchFrench American IndianFrench CanadianGermanGerman RussianGhanaianGreekGuamanian/ChamorroGuatemalanGuyaneseHaitianHmongHonduranHopiHoumaHungarianIcelanderIndian (Asian)IndonesianInupiatIranianIraqiIrishIroquoisIsraeliItalianJamaicanJapaneseJordanianKenyanKiowaKoreanLaotianLatvianLebaneseLiberianLithuanianLumbeeLuxembourgerMacedonianMalaysianMalteseMarshalleseMenomineeMexicanMexican American IndianMongolianMoroccanNative HawaiianNavajoNepaleseNew ZealanderNicaraguanNigerianNorthern EuropeanNorwegianOkinawanOsageOttawaPaiutePakistaniPalestinianPanamanianParaguayanPennsylvania GermanPeruvianPimaPolishPortuguesePotawatomiPuebloPuerto RicanPuget Sound SalishRomanianRussianSalvadoranSamoanScandinavianScotch-IrishScottishSeminoleSenegaleseSerbianShoshoneSierra LeoneanSiouxSlavicSlovakSloveneSomaliSouth AfricanSouth AmericanSouth American IndianSoviet UnionSpaniardSpanishSpanish AmericanSpanish American IndianSri LankanSubsaharan AfricanSudaneseSwedishSwissSyrianTaiwaneseThaiTlingit-HaidaTohono O'OdhamTonganTrinidadian and TobagonianTsimshianTurkishU.S. Virgin IslanderUgandanUkrainianUruguayanUteVenezuelanVietnameseWelshWest IndianYakamaYaquiYugoslavianYumanYup'ikZimbabwean
Immigration
NonimmigrantsImmigrantsAfghanistanAfricaAlbaniaArgentinaArmeniaAsiaAustraliaAustriaBahamasBangladeshBarbadosBelarusBelgiumBelizeBoliviaBosnia and HerzegovinaBrazilBulgariaBurma/MyanmarCabo VerdeCambodiaCameroonCanadaCaribbeanCentral AmericaChileChinaColombiaCongoCosta RicaCroatiaCubaCzechoslovakiaDenmarkDominicaDominican RepublicEastern AfricaEastern AsiaEastern EuropeEcuadorEgyptEl SalvadorEnglandEritreaEthiopiaEuropeFijiFranceGermanyGhanaGreeceGrenadaGuatemalaGuyanaHaitiHondurasHong KongHungaryIndiaIndonesiaIranIraqIrelandIsraelItalyJamaicaJapanJordanKazakhstanKenyaKoreaKuwaitLaosLatin AmericaLatviaLebanonLiberiaLithuaniaMalaysiaMexicoMicronesiaMiddle AfricaMoldovaMoroccoNepalNetherlandsNicaraguaNigeriaNorth AmericaNorth MacedoniaNorthern AfricaNorthern EuropeNorwayOceaniaPakistanPanamaPeruPhilippinesPolandPortugalRomaniaRussiaSaudi ArabiaScotlandSenegalSerbiaSierra LeoneSingaporeSomaliaSouth AfricaSouth AmericaSouth Central AsiaSouth Eastern AsiaSouthern EuropeSpainSri LankaSt. Vincent and the GrenadinesSudanSwedenSwitzerlandSyriaTaiwanThailandTrinidad and TobagoTurkeyUgandaUkraineUruguayUzbekistanVenezuelaVietnamWest IndiesWestern AfricaWestern AsiaWestern EuropeYemenZaireZimbabweAzores
12th Grade, No Diploma
Income
Poverty
Unemployment
Labor Participation
Family Structure
Vehicle Availability
Education Level
Disability

12th Grade, No Diploma Comparison

Hispanics or Latinos

Immigrants from Iran

Tragic
Exceptional
85.4%
12TH GRADE, NO DIPLOMA
0.0/ 100
METRIC RATING
329th/ 347
METRIC RANK
92.7%
12TH GRADE, NO DIPLOMA
99.5/ 100
METRIC RATING
69th/ 347
METRIC RANK

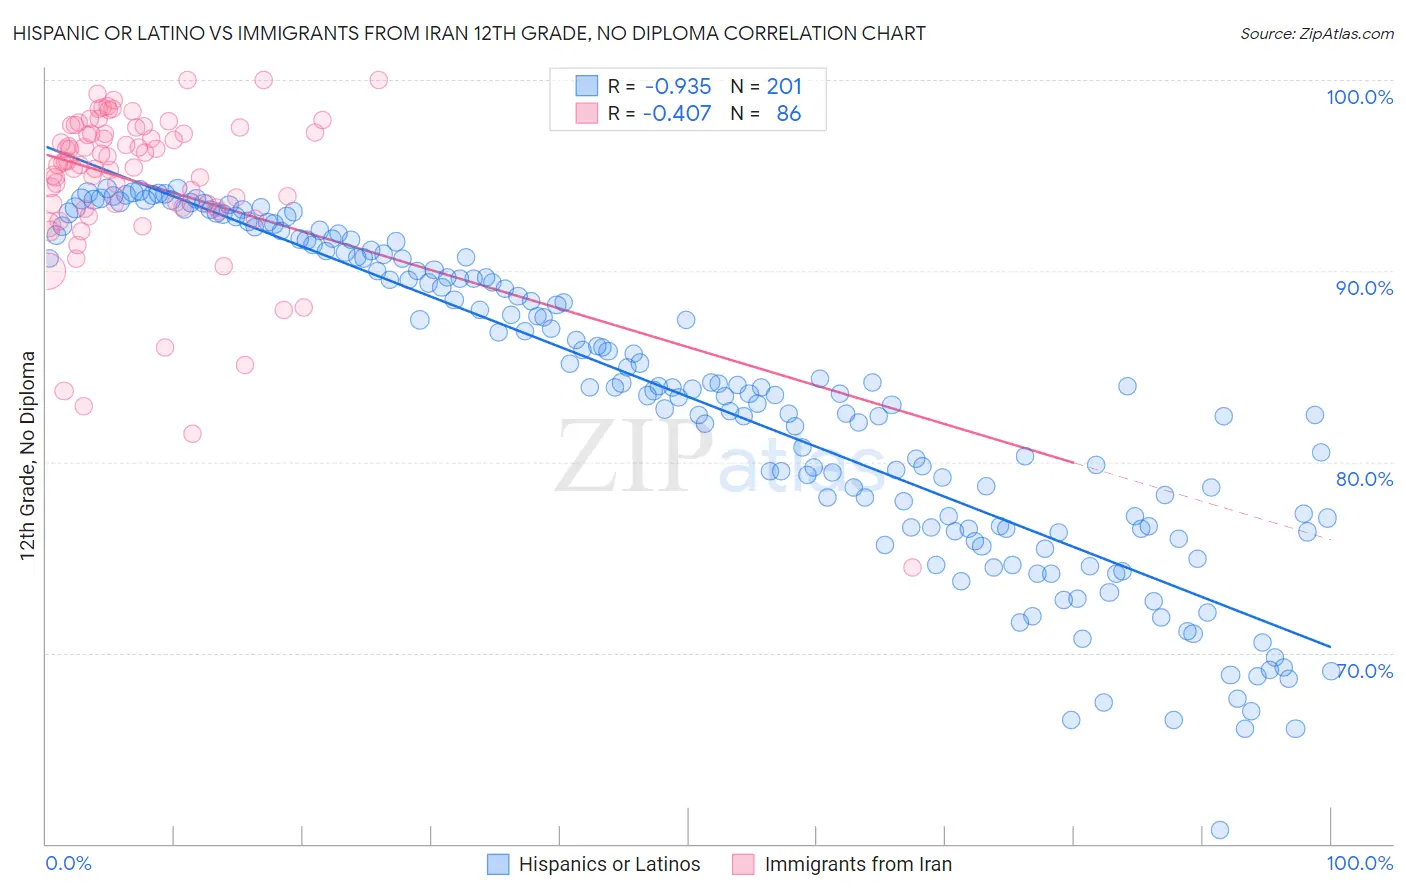
Hispanic or Latino vs Immigrants from Iran 12th Grade, No Diploma Correlation Chart

The statistical analysis conducted on geographies consisting of 578,613,277 people shows a near-perfect negative correlation between the proportion of Hispanics or Latinos and percentage of population with at least 12th grade (no diploma) education in the United States with a correlation coefficient (R) of -0.935 and weighted average of 85.4%. Similarly, the statistical analysis conducted on geographies consisting of 279,904,902 people shows a moderate negative correlation between the proportion of Immigrants from Iran and percentage of population with at least 12th grade (no diploma) education in the United States with a correlation coefficient (R) of -0.407 and weighted average of 92.7%, a difference of 8.4%.
Hispanic or Latino vs Immigrants from Iran 12th Grade, No Diploma

12th Grade, No Diploma Correlation Summary

MeasurementHispanic or LatinoImmigrants from Iran
Minimum60.7%74.5%
Maximum94.3%100.0%
Range33.6%25.5%
Mean83.3%94.6%
Median83.9%95.6%
Interquartile 25% (IQ1)76.6%93.3%
Interquartile 75% (IQ3)90.8%97.3%
Interquartile Range (IQR)14.2%3.9%
Standard Deviation (Sample)8.2%4.4%
Standard Deviation (Population)8.1%4.3%

Similar Demographics by 12th Grade, No Diploma

Demographics Similar to Hispanics or Latinos by 12th Grade, No Diploma

In terms of 12th grade, no diploma, the demographic groups most similar to Hispanics or Latinos are Honduran (85.5%, a difference of 0.090%), Immigrants from the Azores (85.3%, a difference of 0.14%), Lumbee (85.7%, a difference of 0.28%), Central American (85.2%, a difference of 0.28%), and Dominican (85.7%, a difference of 0.30%).
DemographicsRating | Rank12th Grade, No Diploma
Central American Indians
0.0
/100
|
#322
Tragic
86.5%
Yuman
0.0
/100
|
#323
Tragic
86.5%
Immigrants | Cabo Verde
0.0
/100
|
#324
Tragic
85.8%
Mexican American Indians
0.0
/100
|
#325
Tragic
85.7%
Dominicans
0.0
/100
|
#326
Tragic
85.7%
Lumbee
0.0
/100
|
#327
Tragic
85.7%
Hondurans
0.0
/100
|
#328
Tragic
85.5%
Hispanics or Latinos
0.0
/100
|
#329
Tragic
85.4%
Immigrants | Azores
0.0
/100
|
#330
Tragic
85.3%
Central Americans
0.0
/100
|
#331
Tragic
85.2%
Immigrants | Honduras
0.0
/100
|
#332
Tragic
85.0%
Immigrants | Latin America
0.0
/100
|
#333
Tragic
85.0%
Immigrants | Dominican Republic
0.0
/100
|
#334
Tragic
84.9%
Immigrants | Yemen
0.0
/100
|
#335
Tragic
84.8%
Tohono O'odham
0.0
/100
|
#336
Tragic
84.7%

Demographics Similar to Immigrants from Iran by 12th Grade, No Diploma

In terms of 12th grade, no diploma, the demographic groups most similar to Immigrants from Iran are Immigrants from Czechoslovakia (92.7%, a difference of 0.0%), Immigrants from South Africa (92.7%, a difference of 0.010%), Czechoslovakian (92.6%, a difference of 0.010%), Immigrants from Latvia (92.6%, a difference of 0.020%), and Immigrants from South Central Asia (92.6%, a difference of 0.030%).
DemographicsRating | Rank12th Grade, No Diploma
Ukrainians
99.6
/100
|
#62
Exceptional
92.7%
Zimbabweans
99.6
/100
|
#63
Exceptional
92.7%
Immigrants | Netherlands
99.6
/100
|
#64
Exceptional
92.7%
Austrians
99.6
/100
|
#65
Exceptional
92.7%
Soviet Union
99.6
/100
|
#66
Exceptional
92.7%
Immigrants | South Africa
99.5
/100
|
#67
Exceptional
92.7%
Immigrants | Czechoslovakia
99.5
/100
|
#68
Exceptional
92.7%
Immigrants | Iran
99.5
/100
|
#69
Exceptional
92.7%
Czechoslovakians
99.5
/100
|
#70
Exceptional
92.6%
Immigrants | Latvia
99.5
/100
|
#71
Exceptional
92.6%
Immigrants | South Central Asia
99.5
/100
|
#72
Exceptional
92.6%
Burmese
99.4
/100
|
#73
Exceptional
92.6%
Immigrants | Moldova
99.4
/100
|
#74
Exceptional
92.6%
Native Hawaiians
99.4
/100
|
#75
Exceptional
92.6%
French
99.4
/100
|
#76
Exceptional
92.6%