Hawaiian vs Immigrants from Hungary Doctorate Degree
COMPARE
Hawaiian
Immigrants from Hungary
Doctorate Degree
Doctorate Degree Comparison
Hawaiians
Immigrants from Hungary
1.5%
DOCTORATE DEGREE
0.4/ 100
METRIC RATING
278th/ 347
METRIC RANK
2.2%
DOCTORATE DEGREE
99.8/ 100
METRIC RATING
76th/ 347
METRIC RANK
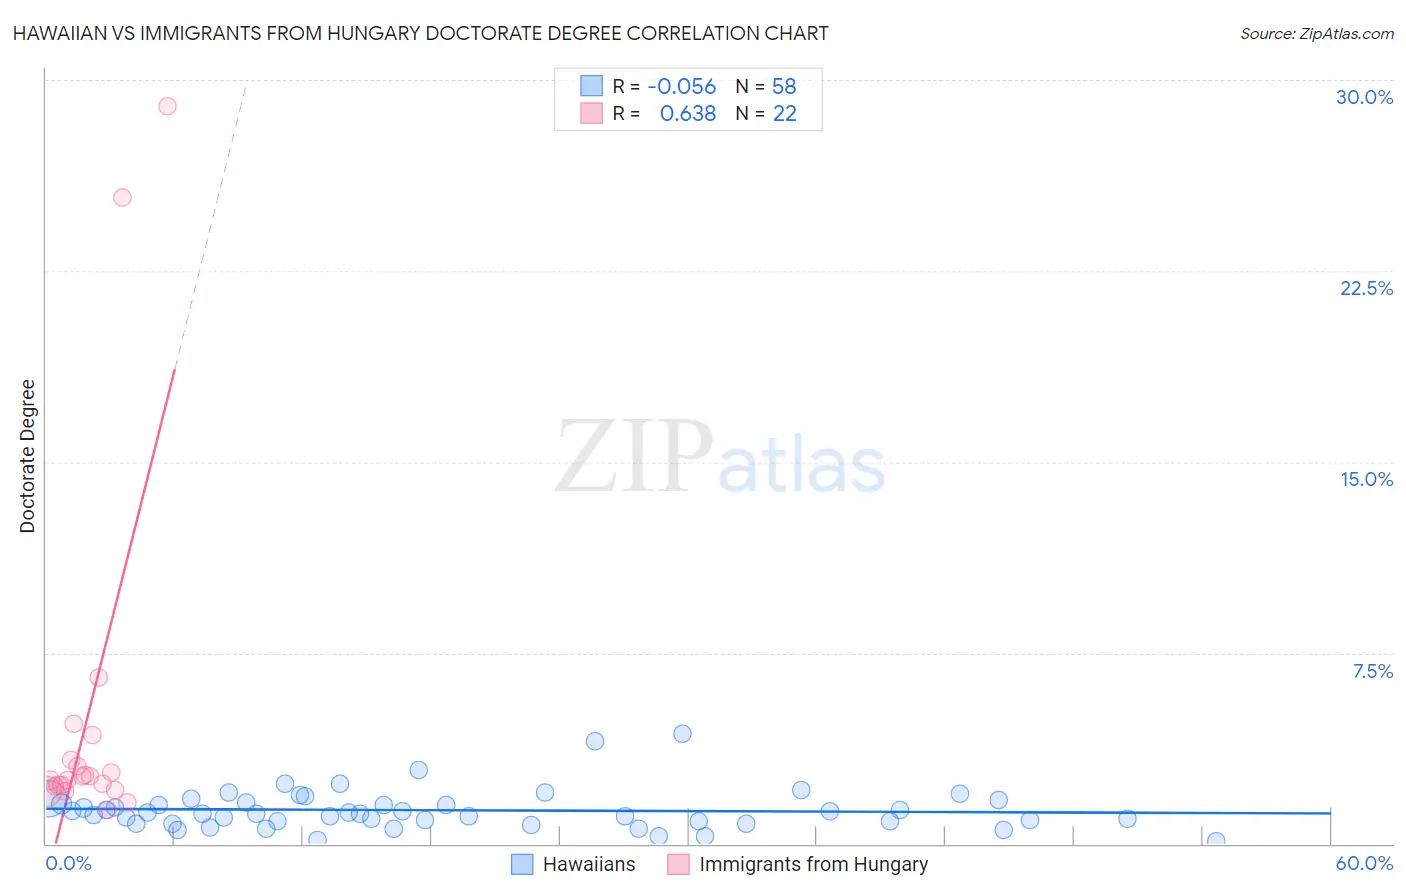
Hawaiian vs Immigrants from Hungary Doctorate Degree Correlation Chart
The statistical analysis conducted on geographies consisting of 323,773,151 people shows a slight negative correlation between the proportion of Hawaiians and percentage of population with at least doctorate degree education in the United States with a correlation coefficient (R) of -0.056 and weighted average of 1.5%. Similarly, the statistical analysis conducted on geographies consisting of 195,058,211 people shows a significant positive correlation between the proportion of Immigrants from Hungary and percentage of population with at least doctorate degree education in the United States with a correlation coefficient (R) of 0.638 and weighted average of 2.2%, a difference of 53.6%.
Doctorate Degree Correlation Summary
| Measurement | Hawaiian | Immigrants from Hungary |
| Minimum | 0.092% | 1.3% |
| Maximum | 4.3% | 29.0% |
| Range | 4.2% | 27.7% |
| Mean | 1.3% | 5.0% |
| Median | 1.2% | 2.6% |
| Interquartile 25% (IQ1) | 0.88% | 2.2% |
| Interquartile 75% (IQ3) | 1.6% | 3.3% |
| Interquartile Range (IQR) | 0.73% | 1.1% |
| Standard Deviation (Sample) | 0.79% | 7.3% |
| Standard Deviation (Population) | 0.78% | 7.1% |
Similar Demographics by Doctorate Degree
Demographics Similar to Hawaiians by Doctorate Degree
In terms of doctorate degree, the demographic groups most similar to Hawaiians are Bahamian (1.5%, a difference of 0.060%), Marshallese (1.5%, a difference of 0.22%), Ecuadorian (1.5%, a difference of 0.23%), Tohono O'odham (1.5%, a difference of 0.30%), and British West Indian (1.5%, a difference of 0.35%).
| Demographics | Rating | Rank | Doctorate Degree |
| Immigrants | Trinidad and Tobago | 0.5 /100 | #271 | Tragic 1.5% |
| Immigrants | Barbados | 0.4 /100 | #272 | Tragic 1.5% |
| Sioux | 0.4 /100 | #273 | Tragic 1.5% |
| Yaqui | 0.4 /100 | #274 | Tragic 1.5% |
| Aleuts | 0.4 /100 | #275 | Tragic 1.5% |
| Paiute | 0.4 /100 | #276 | Tragic 1.5% |
| Bahamians | 0.4 /100 | #277 | Tragic 1.5% |
| Hawaiians | 0.4 /100 | #278 | Tragic 1.5% |
| Marshallese | 0.4 /100 | #279 | Tragic 1.5% |
| Ecuadorians | 0.4 /100 | #280 | Tragic 1.5% |
| Tohono O'odham | 0.4 /100 | #281 | Tragic 1.5% |
| British West Indians | 0.3 /100 | #282 | Tragic 1.5% |
| Central Americans | 0.3 /100 | #283 | Tragic 1.5% |
| Jamaicans | 0.3 /100 | #284 | Tragic 1.5% |
| Malaysians | 0.3 /100 | #285 | Tragic 1.5% |
Demographics Similar to Immigrants from Hungary by Doctorate Degree
In terms of doctorate degree, the demographic groups most similar to Immigrants from Hungary are Immigrants from Lebanon (2.2%, a difference of 0.010%), Immigrants from Western Asia (2.2%, a difference of 0.070%), Immigrants from North America (2.2%, a difference of 0.18%), Immigrants from Bulgaria (2.3%, a difference of 0.31%), and Immigrants from Canada (2.3%, a difference of 0.40%).
| Demographics | Rating | Rank | Doctorate Degree |
| Carpatho Rusyns | 99.8 /100 | #69 | Exceptional 2.3% |
| Lithuanians | 99.8 /100 | #70 | Exceptional 2.3% |
| Immigrants | Bolivia | 99.8 /100 | #71 | Exceptional 2.3% |
| Immigrants | Canada | 99.8 /100 | #72 | Exceptional 2.3% |
| Immigrants | Bulgaria | 99.8 /100 | #73 | Exceptional 2.3% |
| Immigrants | North America | 99.8 /100 | #74 | Exceptional 2.2% |
| Immigrants | Western Asia | 99.8 /100 | #75 | Exceptional 2.2% |
| Immigrants | Hungary | 99.8 /100 | #76 | Exceptional 2.2% |
| Immigrants | Lebanon | 99.8 /100 | #77 | Exceptional 2.2% |
| Immigrants | Belarus | 99.7 /100 | #78 | Exceptional 2.2% |
| Northern Europeans | 99.7 /100 | #79 | Exceptional 2.2% |
| Ugandans | 99.7 /100 | #80 | Exceptional 2.2% |
| Immigrants | Argentina | 99.7 /100 | #81 | Exceptional 2.2% |
| Immigrants | Uganda | 99.6 /100 | #82 | Exceptional 2.2% |
| Immigrants | Lithuania | 99.6 /100 | #83 | Exceptional 2.2% |