Hawaiian vs Icelander 8th Grade

COMPARE

Hawaiian
Race
Ancestry
AfghanAfricanAlaska NativeAlaskan AthabascanAlbanianAleutAlsatianAmericanApacheArabArapahoArgentineanArmenianAssyrian/Chaldean/SyriacAustralianAustrianBahamianBangladeshiBarbadianBasqueBelgianBelizeanBermudanBhutaneseBlackfeetBolivianBrazilianBritishBritish West IndianBulgarianBurmeseCajunCambodianCanadianCape VerdeanCarpatho RusynCelticCentral AmericanCentral American IndianCherokeeCheyenneChickasawChileanChineseChippewaChoctawColombianColvilleComancheCosta RicanCreeCreekCroatianCrowCubanCypriotCzechCzechoslovakianDanishDelawareDominicanDutchDutch West IndianEastern EuropeanEcuadorianEgyptianEnglishEstonianEthiopianEuropeanFijianFilipinoFinnishFrenchFrench American IndianFrench CanadianGermanGerman RussianGhanaianGreekGuamanian/ChamorroGuatemalanGuyaneseHaitianHmongHonduranHopiHoumaHungarianIndian (Asian)IndonesianInupiatIranianIraqiIrishIroquoisIsraeliItalianJamaicanJapaneseJordanianKenyanKiowaKoreanLaotianLatvianLebaneseLiberianLithuanianLumbeeLuxembourgerMacedonianMalaysianMalteseMarshalleseMenomineeMexicanMexican American IndianMongolianMoroccanNative HawaiianNavajoNepaleseNew ZealanderNicaraguanNigerianNorthern EuropeanNorwegianOkinawanOsageOttawaPaiutePakistaniPalestinianPanamanianParaguayanPennsylvania GermanPeruvianPimaPolishPortuguesePotawatomiPuebloPuerto RicanPuget Sound SalishRomanianRussianSalvadoranSamoanScandinavianScotch-IrishScottishSeminoleSenegaleseSerbianShoshoneSierra LeoneanSiouxSlavicSlovakSloveneSomaliSouth AfricanSouth AmericanSouth American IndianSoviet UnionSpaniardSpanishSpanish AmericanSpanish American IndianSri LankanSubsaharan AfricanSudaneseSwedishSwissSyrianTaiwaneseThaiTlingit-HaidaTohono O'OdhamTonganTrinidadian and TobagonianTsimshianTurkishU.S. Virgin IslanderUgandanUkrainianUruguayanUteVenezuelanVietnameseWelshWest IndianYakamaYaquiYugoslavianYumanYup'ikZimbabwean
Immigration
NonimmigrantsImmigrantsAfghanistanAfricaAlbaniaArgentinaArmeniaAsiaAustraliaAustriaBahamasBangladeshBarbadosBelarusBelgiumBelizeBoliviaBosnia and HerzegovinaBrazilBulgariaBurma/MyanmarCabo VerdeCambodiaCameroonCanadaCaribbeanCentral AmericaChileChinaColombiaCongoCosta RicaCroatiaCubaCzechoslovakiaDenmarkDominicaDominican RepublicEastern AfricaEastern AsiaEastern EuropeEcuadorEgyptEl SalvadorEnglandEritreaEthiopiaEuropeFijiFranceGermanyGhanaGreeceGrenadaGuatemalaGuyanaHaitiHondurasHong KongHungaryIndiaIndonesiaIranIraqIrelandIsraelItalyJamaicaJapanJordanKazakhstanKenyaKoreaKuwaitLaosLatin AmericaLatviaLebanonLiberiaLithuaniaMalaysiaMexicoMicronesiaMiddle AfricaMoldovaMoroccoNepalNetherlandsNicaraguaNigeriaNorth AmericaNorth MacedoniaNorthern AfricaNorthern EuropeNorwayOceaniaPakistanPanamaPeruPhilippinesPolandPortugalRomaniaRussiaSaudi ArabiaScotlandSenegalSerbiaSierra LeoneSingaporeSomaliaSouth AfricaSouth AmericaSouth Central AsiaSouth Eastern AsiaSouthern EuropeSpainSri LankaSt. Vincent and the GrenadinesSudanSwedenSwitzerlandSyriaTaiwanThailandTrinidad and TobagoTurkeyUgandaUkraineUruguayUzbekistanVenezuelaVietnamWest IndiesWestern AfricaWestern AsiaWestern EuropeYemenZaireZimbabweAzores
Icelander
Race
Ancestry
AfghanAfricanAlaska NativeAlaskan AthabascanAlbanianAleutAlsatianAmericanApacheArabArapahoArgentineanArmenianAssyrian/Chaldean/SyriacAustralianAustrianBahamianBangladeshiBarbadianBasqueBelgianBelizeanBermudanBhutaneseBlackfeetBolivianBrazilianBritishBritish West IndianBulgarianBurmeseCajunCambodianCanadianCape VerdeanCarpatho RusynCelticCentral AmericanCentral American IndianCherokeeCheyenneChickasawChileanChineseChippewaChoctawColombianColvilleComancheCosta RicanCreeCreekCroatianCrowCubanCypriotCzechCzechoslovakianDanishDelawareDominicanDutchDutch West IndianEastern EuropeanEcuadorianEgyptianEnglishEstonianEthiopianEuropeanFijianFilipinoFinnishFrenchFrench American IndianFrench CanadianGermanGerman RussianGhanaianGreekGuamanian/ChamorroGuatemalanGuyaneseHaitianHmongHonduranHopiHoumaHungarianIcelanderIndian (Asian)IndonesianInupiatIranianIraqiIrishIroquoisIsraeliItalianJamaicanJapaneseJordanianKenyanKiowaKoreanLaotianLatvianLebaneseLiberianLithuanianLumbeeLuxembourgerMacedonianMalaysianMalteseMarshalleseMenomineeMexicanMexican American IndianMongolianMoroccanNative HawaiianNavajoNepaleseNew ZealanderNicaraguanNigerianNorthern EuropeanNorwegianOkinawanOsageOttawaPaiutePakistaniPalestinianPanamanianParaguayanPennsylvania GermanPeruvianPimaPolishPortuguesePotawatomiPuebloPuerto RicanPuget Sound SalishRomanianRussianSalvadoranSamoanScandinavianScotch-IrishScottishSeminoleSenegaleseSerbianShoshoneSierra LeoneanSiouxSlavicSlovakSloveneSomaliSouth AfricanSouth AmericanSouth American IndianSoviet UnionSpaniardSpanishSpanish AmericanSpanish American IndianSri LankanSubsaharan AfricanSudaneseSwedishSwissSyrianTaiwaneseThaiTlingit-HaidaTohono O'OdhamTonganTrinidadian and TobagonianTsimshianTurkishU.S. Virgin IslanderUgandanUkrainianUruguayanUteVenezuelanVietnameseWelshWest IndianYakamaYaquiYugoslavianYumanYup'ikZimbabwean
Immigration
NonimmigrantsImmigrantsAfghanistanAfricaAlbaniaArgentinaArmeniaAsiaAustraliaAustriaBahamasBangladeshBarbadosBelarusBelgiumBelizeBoliviaBosnia and HerzegovinaBrazilBulgariaBurma/MyanmarCabo VerdeCambodiaCameroonCanadaCaribbeanCentral AmericaChileChinaColombiaCongoCosta RicaCroatiaCubaCzechoslovakiaDenmarkDominicaDominican RepublicEastern AfricaEastern AsiaEastern EuropeEcuadorEgyptEl SalvadorEnglandEritreaEthiopiaEuropeFijiFranceGermanyGhanaGreeceGrenadaGuatemalaGuyanaHaitiHondurasHong KongHungaryIndiaIndonesiaIranIraqIrelandIsraelItalyJamaicaJapanJordanKazakhstanKenyaKoreaKuwaitLaosLatin AmericaLatviaLebanonLiberiaLithuaniaMalaysiaMexicoMicronesiaMiddle AfricaMoldovaMoroccoNepalNetherlandsNicaraguaNigeriaNorth AmericaNorth MacedoniaNorthern AfricaNorthern EuropeNorwayOceaniaPakistanPanamaPeruPhilippinesPolandPortugalRomaniaRussiaSaudi ArabiaScotlandSenegalSerbiaSierra LeoneSingaporeSomaliaSouth AfricaSouth AmericaSouth Central AsiaSouth Eastern AsiaSouthern EuropeSpainSri LankaSt. Vincent and the GrenadinesSudanSwedenSwitzerlandSyriaTaiwanThailandTrinidad and TobagoTurkeyUgandaUkraineUruguayUzbekistanVenezuelaVietnamWest IndiesWestern AfricaWestern AsiaWestern EuropeYemenZaireZimbabweAzores
8th Grade
Income
Poverty
Unemployment
Labor Participation
Family Structure
Vehicle Availability
Education Level
Disability

8th Grade Comparison

Hawaiians

Icelanders

Poor
Exceptional
95.5%
8TH GRADE
16.7/ 100
METRIC RATING
204th/ 347
METRIC RANK
96.5%
8TH GRADE
99.2/ 100
METRIC RATING
83rd/ 347
METRIC RANK

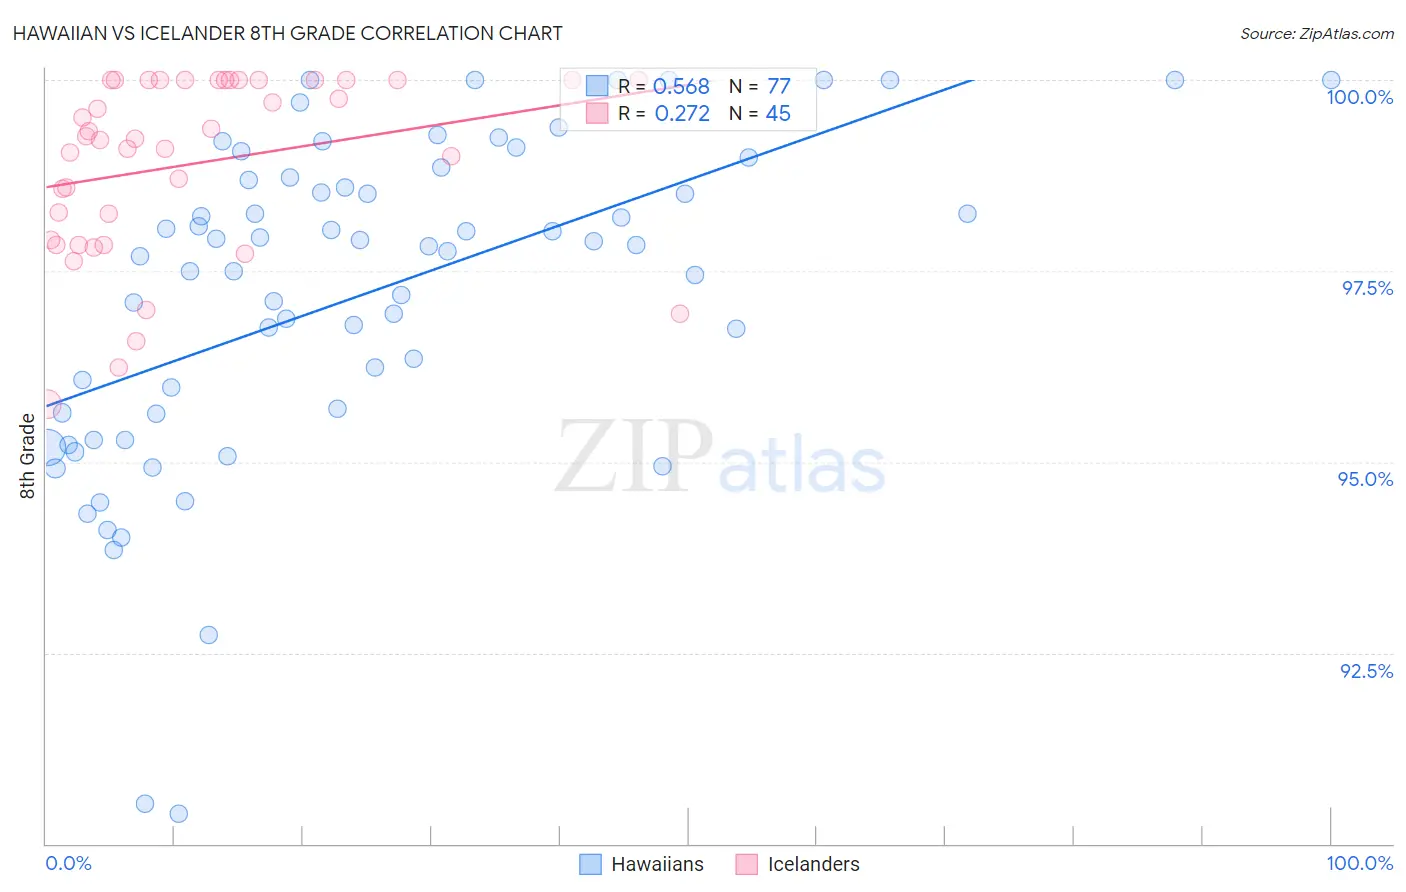
Hawaiian vs Icelander 8th Grade Correlation Chart

The statistical analysis conducted on geographies consisting of 327,621,279 people shows a substantial positive correlation between the proportion of Hawaiians and percentage of population with at least 8th grade education in the United States with a correlation coefficient (R) of 0.568 and weighted average of 95.5%. Similarly, the statistical analysis conducted on geographies consisting of 159,668,915 people shows a weak positive correlation between the proportion of Icelanders and percentage of population with at least 8th grade education in the United States with a correlation coefficient (R) of 0.272 and weighted average of 96.5%, a difference of 1.0%.
Hawaiian vs Icelander 8th Grade

8th Grade Correlation Summary

MeasurementHawaiianIcelander
Minimum90.4%95.8%
Maximum100.0%100.0%
Range9.6%4.2%
Mean97.2%98.9%
Median97.8%99.2%
Interquartile 25% (IQ1)95.6%97.9%
Interquartile 75% (IQ3)98.7%100.0%
Interquartile Range (IQR)3.1%2.1%
Standard Deviation (Sample)2.1%1.2%
Standard Deviation (Population)2.1%1.2%

Similar Demographics by 8th Grade

Demographics Similar to Hawaiians by 8th Grade

In terms of 8th grade, the demographic groups most similar to Hawaiians are Immigrants from Bahamas (95.5%, a difference of 0.0%), Moroccan (95.5%, a difference of 0.010%), Comanche (95.5%, a difference of 0.010%), Immigrants from Sudan (95.5%, a difference of 0.020%), and Apache (95.5%, a difference of 0.030%).
DemographicsRating | Rank8th Grade
Sierra Leoneans
24.3
/100
|
#197
Fair
95.6%
Paraguayans
22.6
/100
|
#198
Fair
95.5%
Immigrants | Northern Africa
22.5
/100
|
#199
Fair
95.5%
Argentineans
22.2
/100
|
#200
Fair
95.5%
Immigrants | Argentina
20.6
/100
|
#201
Fair
95.5%
Apache
19.4
/100
|
#202
Poor
95.5%
Moroccans
17.4
/100
|
#203
Poor
95.5%
Hawaiians
16.7
/100
|
#204
Poor
95.5%
Immigrants | Bahamas
16.7
/100
|
#205
Poor
95.5%
Comanche
16.3
/100
|
#206
Poor
95.5%
Immigrants | Sudan
15.1
/100
|
#207
Poor
95.5%
Portuguese
14.3
/100
|
#208
Poor
95.5%
Immigrants | Lebanon
13.7
/100
|
#209
Poor
95.4%
Africans
13.6
/100
|
#210
Poor
95.4%
Immigrants | Morocco
12.4
/100
|
#211
Poor
95.4%

Demographics Similar to Icelanders by 8th Grade

In terms of 8th grade, the demographic groups most similar to Icelanders are Delaware (96.5%, a difference of 0.010%), Romanian (96.5%, a difference of 0.010%), Turkish (96.5%, a difference of 0.010%), Immigrants from Belgium (96.5%, a difference of 0.010%), and Immigrants from South Africa (96.5%, a difference of 0.020%).
DemographicsRating | Rank8th Grade
Immigrants | Netherlands
99.4
/100
|
#76
Exceptional
96.5%
Cypriots
99.4
/100
|
#77
Exceptional
96.5%
Yugoslavians
99.4
/100
|
#78
Exceptional
96.5%
Puget Sound Salish
99.3
/100
|
#79
Exceptional
96.5%
Delaware
99.2
/100
|
#80
Exceptional
96.5%
Romanians
99.2
/100
|
#81
Exceptional
96.5%
Turks
99.2
/100
|
#82
Exceptional
96.5%
Icelanders
99.2
/100
|
#83
Exceptional
96.5%
Immigrants | Belgium
99.1
/100
|
#84
Exceptional
96.5%
Immigrants | South Africa
99.1
/100
|
#85
Exceptional
96.5%
Cherokee
99.0
/100
|
#86
Exceptional
96.5%
Immigrants | Australia
99.0
/100
|
#87
Exceptional
96.5%
Immigrants | Western Europe
99.0
/100
|
#88
Exceptional
96.4%
Chickasaw
98.9
/100
|
#89
Exceptional
96.4%
Immigrants | Sweden
98.9
/100
|
#90
Exceptional
96.4%