Haitian vs Immigrants from Ukraine Doctorate Degree
COMPARE
Haitian
Immigrants from Ukraine
Doctorate Degree
Doctorate Degree Comparison
Haitians
Immigrants from Ukraine
1.3%
DOCTORATE DEGREE
0.0/ 100
METRIC RATING
329th/ 347
METRIC RANK
2.0%
DOCTORATE DEGREE
90.5/ 100
METRIC RATING
130th/ 347
METRIC RANK
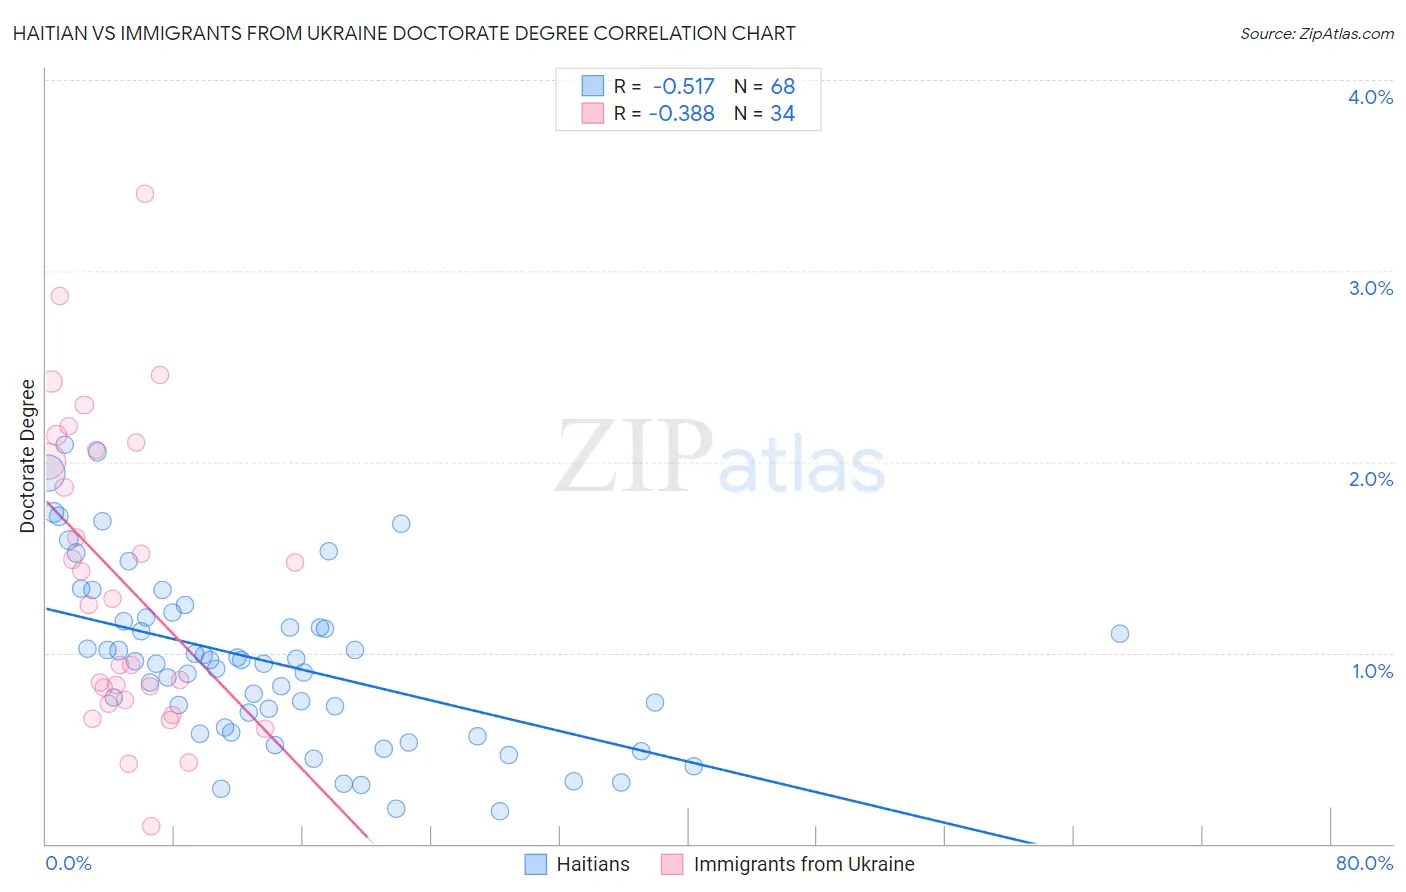
Haitian vs Immigrants from Ukraine Doctorate Degree Correlation Chart
The statistical analysis conducted on geographies consisting of 285,866,537 people shows a substantial negative correlation between the proportion of Haitians and percentage of population with at least doctorate degree education in the United States with a correlation coefficient (R) of -0.517 and weighted average of 1.3%. Similarly, the statistical analysis conducted on geographies consisting of 288,420,787 people shows a mild negative correlation between the proportion of Immigrants from Ukraine and percentage of population with at least doctorate degree education in the United States with a correlation coefficient (R) of -0.388 and weighted average of 2.0%, a difference of 52.4%.
Doctorate Degree Correlation Summary
| Measurement | Haitian | Immigrants from Ukraine |
| Minimum | 0.17% | 0.095% |
| Maximum | 2.1% | 3.4% |
| Range | 1.9% | 3.3% |
| Mean | 0.95% | 1.4% |
| Median | 0.95% | 1.3% |
| Interquartile 25% (IQ1) | 0.60% | 0.75% |
| Interquartile 75% (IQ3) | 1.2% | 2.1% |
| Interquartile Range (IQR) | 0.58% | 1.3% |
| Standard Deviation (Sample) | 0.45% | 0.79% |
| Standard Deviation (Population) | 0.45% | 0.78% |
Similar Demographics by Doctorate Degree
Demographics Similar to Haitians by Doctorate Degree
In terms of doctorate degree, the demographic groups most similar to Haitians are Inupiat (1.3%, a difference of 0.050%), Yup'ik (1.3%, a difference of 0.22%), Immigrants from Latin America (1.3%, a difference of 0.23%), Hispanic or Latino (1.3%, a difference of 0.63%), and Immigrants from Cabo Verde (1.3%, a difference of 0.92%).
| Demographics | Rating | Rank | Doctorate Degree |
| Seminole | 0.1 /100 | #322 | Tragic 1.3% |
| Immigrants | Belize | 0.1 /100 | #323 | Tragic 1.3% |
| Natives/Alaskans | 0.0 /100 | #324 | Tragic 1.3% |
| Pima | 0.0 /100 | #325 | Tragic 1.3% |
| Immigrants | Cabo Verde | 0.0 /100 | #326 | Tragic 1.3% |
| Hispanics or Latinos | 0.0 /100 | #327 | Tragic 1.3% |
| Inupiat | 0.0 /100 | #328 | Tragic 1.3% |
| Haitians | 0.0 /100 | #329 | Tragic 1.3% |
| Yup'ik | 0.0 /100 | #330 | Tragic 1.3% |
| Immigrants | Latin America | 0.0 /100 | #331 | Tragic 1.3% |
| Yakama | 0.0 /100 | #332 | Tragic 1.3% |
| Immigrants | Caribbean | 0.0 /100 | #333 | Tragic 1.3% |
| Immigrants | Dominican Republic | 0.0 /100 | #334 | Tragic 1.3% |
| Immigrants | Haiti | 0.0 /100 | #335 | Tragic 1.3% |
| Nepalese | 0.0 /100 | #336 | Tragic 1.3% |
Demographics Similar to Immigrants from Ukraine by Doctorate Degree
In terms of doctorate degree, the demographic groups most similar to Immigrants from Ukraine are Canadian (2.0%, a difference of 0.010%), Immigrants from Sierra Leone (2.0%, a difference of 0.14%), Immigrants from Zaire (2.0%, a difference of 0.22%), Scottish (2.0%, a difference of 0.41%), and Immigrants from Uzbekistan (2.0%, a difference of 0.46%).
| Demographics | Rating | Rank | Doctorate Degree |
| Croatians | 94.0 /100 | #123 | Exceptional 2.0% |
| Ute | 93.2 /100 | #124 | Exceptional 2.0% |
| Moroccans | 93.0 /100 | #125 | Exceptional 2.0% |
| Jordanians | 92.1 /100 | #126 | Exceptional 2.0% |
| Palestinians | 92.0 /100 | #127 | Exceptional 2.0% |
| Immigrants | Zaire | 91.1 /100 | #128 | Exceptional 2.0% |
| Canadians | 90.6 /100 | #129 | Exceptional 2.0% |
| Immigrants | Ukraine | 90.5 /100 | #130 | Exceptional 2.0% |
| Immigrants | Sierra Leone | 90.2 /100 | #131 | Exceptional 2.0% |
| Scottish | 89.4 /100 | #132 | Excellent 2.0% |
| Immigrants | Uzbekistan | 89.3 /100 | #133 | Excellent 2.0% |
| Immigrants | Cameroon | 88.9 /100 | #134 | Excellent 2.0% |
| Serbians | 88.7 /100 | #135 | Excellent 2.0% |
| Swedes | 88.3 /100 | #136 | Excellent 2.0% |
| South American Indians | 88.3 /100 | #137 | Excellent 2.0% |