Guyanese vs Laotian 7th Grade

COMPARE

Guyanese
Race
Ancestry
AfghanAfricanAlaska NativeAlaskan AthabascanAlbanianAleutAlsatianAmericanApacheArabArapahoArgentineanArmenianAssyrian/Chaldean/SyriacAustralianAustrianBahamianBangladeshiBarbadianBasqueBelgianBelizeanBermudanBhutaneseBlackfeetBolivianBrazilianBritishBritish West IndianBulgarianBurmeseCajunCambodianCanadianCape VerdeanCarpatho RusynCelticCentral AmericanCentral American IndianCherokeeCheyenneChickasawChileanChineseChippewaChoctawColombianColvilleComancheCosta RicanCreeCreekCroatianCrowCubanCypriotCzechCzechoslovakianDanishDelawareDominicanDutchDutch West IndianEastern EuropeanEcuadorianEgyptianEnglishEstonianEthiopianEuropeanFijianFilipinoFinnishFrenchFrench American IndianFrench CanadianGermanGerman RussianGhanaianGreekGuamanian/ChamorroGuatemalanGuyaneseHaitianHmongHonduranHopiHoumaHungarianIcelanderIndian (Asian)IndonesianInupiatIranianIraqiIrishIroquoisIsraeliItalianJamaicanJapaneseJordanianKenyanKiowaKoreanLatvianLebaneseLiberianLithuanianLumbeeLuxembourgerMacedonianMalaysianMalteseMarshalleseMenomineeMexicanMexican American IndianMongolianMoroccanNative HawaiianNavajoNepaleseNew ZealanderNicaraguanNigerianNorthern EuropeanNorwegianOkinawanOsageOttawaPaiutePakistaniPalestinianPanamanianParaguayanPennsylvania GermanPeruvianPimaPolishPortuguesePotawatomiPuebloPuerto RicanPuget Sound SalishRomanianRussianSalvadoranSamoanScandinavianScotch-IrishScottishSeminoleSenegaleseSerbianShoshoneSierra LeoneanSiouxSlavicSlovakSloveneSomaliSouth AfricanSouth AmericanSouth American IndianSoviet UnionSpaniardSpanishSpanish AmericanSpanish American IndianSri LankanSubsaharan AfricanSudaneseSwedishSwissSyrianTaiwaneseThaiTlingit-HaidaTohono O'OdhamTonganTrinidadian and TobagonianTsimshianTurkishU.S. Virgin IslanderUgandanUkrainianUruguayanUteVenezuelanVietnameseWelshWest IndianYakamaYaquiYugoslavianYumanYup'ikZimbabwean
Immigration
NonimmigrantsImmigrantsAfghanistanAfricaAlbaniaArgentinaArmeniaAsiaAustraliaAustriaBahamasBangladeshBarbadosBelarusBelgiumBelizeBoliviaBosnia and HerzegovinaBrazilBulgariaBurma/MyanmarCabo VerdeCambodiaCameroonCanadaCaribbeanCentral AmericaChileChinaColombiaCongoCosta RicaCroatiaCubaCzechoslovakiaDenmarkDominicaDominican RepublicEastern AfricaEastern AsiaEastern EuropeEcuadorEgyptEl SalvadorEnglandEritreaEthiopiaEuropeFijiFranceGermanyGhanaGreeceGrenadaGuatemalaGuyanaHaitiHondurasHong KongHungaryIndiaIndonesiaIranIraqIrelandIsraelItalyJamaicaJapanJordanKazakhstanKenyaKoreaKuwaitLaosLatin AmericaLatviaLebanonLiberiaLithuaniaMalaysiaMexicoMicronesiaMiddle AfricaMoldovaMoroccoNepalNetherlandsNicaraguaNigeriaNorth AmericaNorth MacedoniaNorthern AfricaNorthern EuropeNorwayOceaniaPakistanPanamaPeruPhilippinesPolandPortugalRomaniaRussiaSaudi ArabiaScotlandSenegalSerbiaSierra LeoneSingaporeSomaliaSouth AfricaSouth AmericaSouth Central AsiaSouth Eastern AsiaSouthern EuropeSpainSri LankaSt. Vincent and the GrenadinesSudanSwedenSwitzerlandSyriaTaiwanThailandTrinidad and TobagoTurkeyUgandaUkraineUruguayUzbekistanVenezuelaVietnamWest IndiesWestern AfricaWestern AsiaWestern EuropeYemenZaireZimbabweAzores
Laotian
Race
Ancestry
AfghanAfricanAlaska NativeAlaskan AthabascanAlbanianAleutAlsatianAmericanApacheArabArapahoArgentineanArmenianAssyrian/Chaldean/SyriacAustralianAustrianBahamianBangladeshiBarbadianBasqueBelgianBelizeanBermudanBhutaneseBlackfeetBolivianBrazilianBritishBritish West IndianBulgarianBurmeseCajunCambodianCanadianCape VerdeanCarpatho RusynCelticCentral AmericanCentral American IndianCherokeeCheyenneChickasawChileanChineseChippewaChoctawColombianColvilleComancheCosta RicanCreeCreekCroatianCrowCubanCypriotCzechCzechoslovakianDanishDelawareDominicanDutchDutch West IndianEastern EuropeanEcuadorianEgyptianEnglishEstonianEthiopianEuropeanFijianFilipinoFinnishFrenchFrench American IndianFrench CanadianGermanGerman RussianGhanaianGreekGuamanian/ChamorroGuatemalanHaitianHmongHonduranHopiHoumaHungarianIcelanderIndian (Asian)IndonesianInupiatIranianIraqiIrishIroquoisIsraeliItalianJamaicanJapaneseJordanianKenyanKiowaKoreanLaotianLatvianLebaneseLiberianLithuanianLumbeeLuxembourgerMacedonianMalaysianMalteseMarshalleseMenomineeMexicanMexican American IndianMongolianMoroccanNative HawaiianNavajoNepaleseNew ZealanderNicaraguanNigerianNorthern EuropeanNorwegianOkinawanOsageOttawaPaiutePakistaniPalestinianPanamanianParaguayanPennsylvania GermanPeruvianPimaPolishPortuguesePotawatomiPuebloPuerto RicanPuget Sound SalishRomanianRussianSalvadoranSamoanScandinavianScotch-IrishScottishSeminoleSenegaleseSerbianShoshoneSierra LeoneanSiouxSlavicSlovakSloveneSomaliSouth AfricanSouth AmericanSouth American IndianSoviet UnionSpaniardSpanishSpanish AmericanSpanish American IndianSri LankanSubsaharan AfricanSudaneseSwedishSwissSyrianTaiwaneseThaiTlingit-HaidaTohono O'OdhamTonganTrinidadian and TobagonianTsimshianTurkishU.S. Virgin IslanderUgandanUkrainianUruguayanUteVenezuelanVietnameseWelshWest IndianYakamaYaquiYugoslavianYumanYup'ikZimbabwean
Immigration
NonimmigrantsImmigrantsAfghanistanAfricaAlbaniaArgentinaArmeniaAsiaAustraliaAustriaBahamasBangladeshBarbadosBelarusBelgiumBelizeBoliviaBosnia and HerzegovinaBrazilBulgariaBurma/MyanmarCabo VerdeCambodiaCameroonCanadaCaribbeanCentral AmericaChileChinaColombiaCongoCosta RicaCroatiaCubaCzechoslovakiaDenmarkDominicaDominican RepublicEastern AfricaEastern AsiaEastern EuropeEcuadorEgyptEl SalvadorEnglandEritreaEthiopiaEuropeFijiFranceGermanyGhanaGreeceGrenadaGuatemalaGuyanaHaitiHondurasHong KongHungaryIndiaIndonesiaIranIraqIrelandIsraelItalyJamaicaJapanJordanKazakhstanKenyaKoreaKuwaitLaosLatin AmericaLatviaLebanonLiberiaLithuaniaMalaysiaMexicoMicronesiaMiddle AfricaMoldovaMoroccoNepalNetherlandsNicaraguaNigeriaNorth AmericaNorth MacedoniaNorthern AfricaNorthern EuropeNorwayOceaniaPakistanPanamaPeruPhilippinesPolandPortugalRomaniaRussiaSaudi ArabiaScotlandSenegalSerbiaSierra LeoneSingaporeSomaliaSouth AfricaSouth AmericaSouth Central AsiaSouth Eastern AsiaSouthern EuropeSpainSri LankaSt. Vincent and the GrenadinesSudanSwedenSwitzerlandSyriaTaiwanThailandTrinidad and TobagoTurkeyUgandaUkraineUruguayUzbekistanVenezuelaVietnamWest IndiesWestern AfricaWestern AsiaWestern EuropeYemenZaireZimbabweAzores
7th Grade
Income
Poverty
Unemployment
Labor Participation
Family Structure
Vehicle Availability
Education Level
Disability

7th Grade Comparison

Guyanese

Laotians

Tragic
Tragic
94.3%
7TH GRADE
0.0/ 100
METRIC RATING
305th/ 347
METRIC RANK
95.7%
7TH GRADE
6.8/ 100
METRIC RATING
222nd/ 347
METRIC RANK

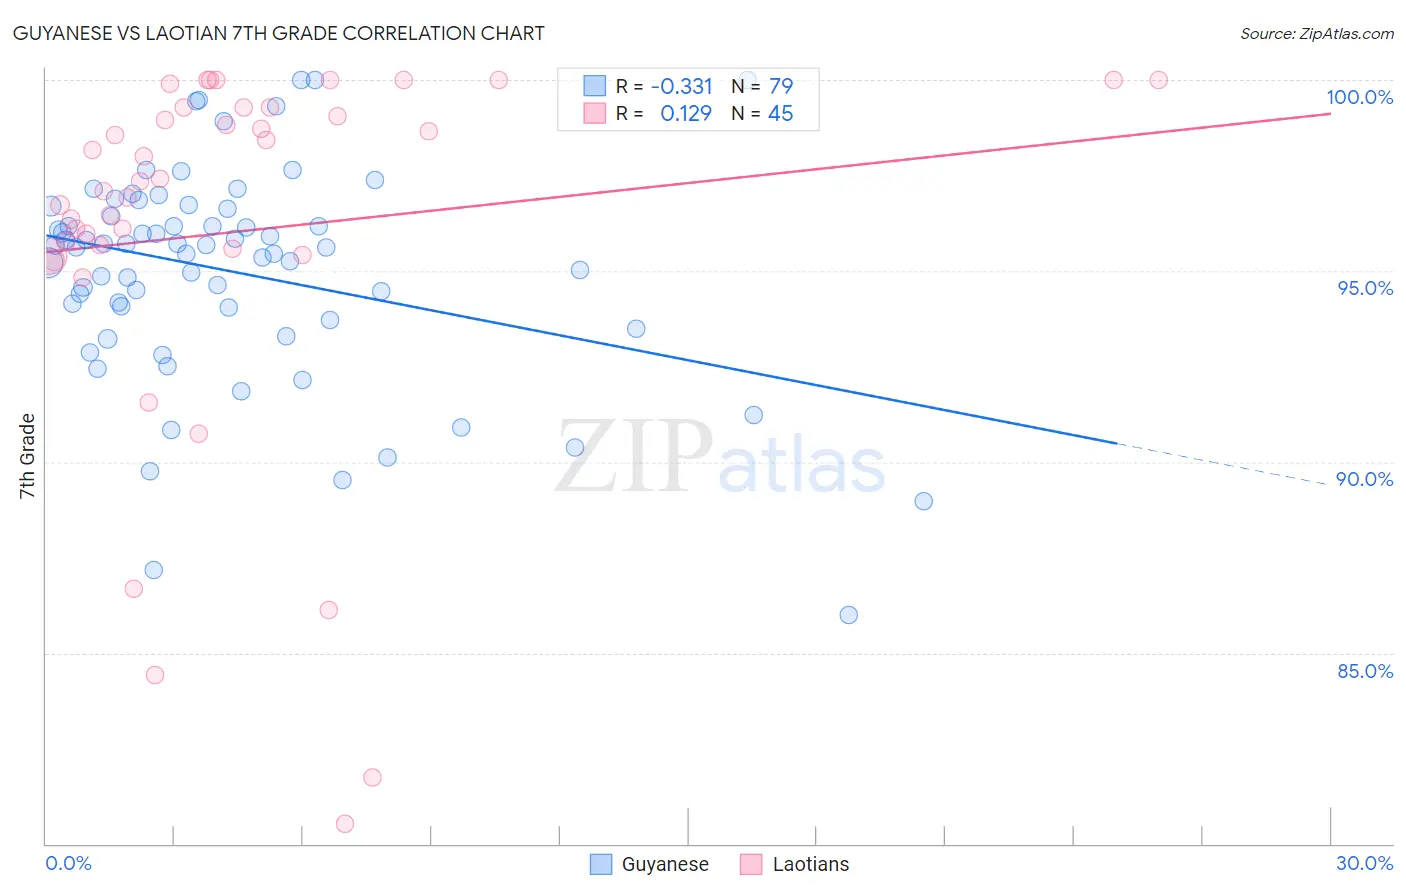
Guyanese vs Laotian 7th Grade Correlation Chart

The statistical analysis conducted on geographies consisting of 176,937,226 people shows a mild negative correlation between the proportion of Guyanese and percentage of population with at least 7th grade education in the United States with a correlation coefficient (R) of -0.331 and weighted average of 94.3%. Similarly, the statistical analysis conducted on geographies consisting of 224,856,886 people shows a poor positive correlation between the proportion of Laotians and percentage of population with at least 7th grade education in the United States with a correlation coefficient (R) of 0.129 and weighted average of 95.7%, a difference of 1.4%.
Guyanese vs Laotian 7th Grade

7th Grade Correlation Summary

MeasurementGuyaneseLaotian
Minimum86.0%80.5%
Maximum100.0%100.0%
Range14.0%19.5%
Mean95.0%96.0%
Median95.6%97.4%
Interquartile 25% (IQ1)93.7%95.5%
Interquartile 75% (IQ3)96.6%99.3%
Interquartile Range (IQR)2.9%3.8%
Standard Deviation (Sample)2.8%4.9%
Standard Deviation (Population)2.8%4.8%

Similar Demographics by 7th Grade

Demographics Similar to Guyanese by 7th Grade

In terms of 7th grade, the demographic groups most similar to Guyanese are Immigrants from Haiti (94.3%, a difference of 0.020%), Sri Lankan (94.4%, a difference of 0.060%), Immigrants from Guyana (94.2%, a difference of 0.13%), Immigrants from Dominica (94.5%, a difference of 0.14%), and Immigrants from Laos (94.5%, a difference of 0.14%).
DemographicsRating | Rank7th Grade
Indonesians
0.0
/100
|
#298
Tragic
94.5%
Bangladeshis
0.0
/100
|
#299
Tragic
94.5%
Immigrants | Burma/Myanmar
0.0
/100
|
#300
Tragic
94.5%
Immigrants | Dominica
0.0
/100
|
#301
Tragic
94.5%
Immigrants | Laos
0.0
/100
|
#302
Tragic
94.5%
Sri Lankans
0.0
/100
|
#303
Tragic
94.4%
Immigrants | Haiti
0.0
/100
|
#304
Tragic
94.3%
Guyanese
0.0
/100
|
#305
Tragic
94.3%
Immigrants | Guyana
0.0
/100
|
#306
Tragic
94.2%
Immigrants | Portugal
0.0
/100
|
#307
Tragic
94.2%
Cape Verdeans
0.0
/100
|
#308
Tragic
94.1%
Ecuadorians
0.0
/100
|
#309
Tragic
94.0%
Immigrants | Caribbean
0.0
/100
|
#310
Tragic
94.0%
Puerto Ricans
0.0
/100
|
#311
Tragic
94.0%
Immigrants | Immigrants
0.0
/100
|
#312
Tragic
94.0%

Demographics Similar to Laotians by 7th Grade

In terms of 7th grade, the demographic groups most similar to Laotians are Samoan (95.7%, a difference of 0.0%), Immigrants from Syria (95.7%, a difference of 0.0%), Immigrants from Oceania (95.7%, a difference of 0.0%), Subsaharan African (95.7%, a difference of 0.010%), and Immigrants from Southern Europe (95.7%, a difference of 0.020%).
DemographicsRating | Rank7th Grade
Spanish Americans
9.3
/100
|
#215
Tragic
95.7%
Immigrants | Chile
9.1
/100
|
#216
Tragic
95.7%
Immigrants | Pakistan
9.0
/100
|
#217
Tragic
95.7%
Immigrants | Liberia
8.1
/100
|
#218
Tragic
95.7%
Immigrants | Southern Europe
7.9
/100
|
#219
Tragic
95.7%
Sub-Saharan Africans
7.2
/100
|
#220
Tragic
95.7%
Samoans
7.0
/100
|
#221
Tragic
95.7%
Laotians
6.8
/100
|
#222
Tragic
95.7%
Immigrants | Syria
6.7
/100
|
#223
Tragic
95.7%
Immigrants | Oceania
6.7
/100
|
#224
Tragic
95.7%
Immigrants | Malaysia
6.2
/100
|
#225
Tragic
95.6%
Immigrants | Eastern Asia
5.8
/100
|
#226
Tragic
95.6%
Immigrants | Western Asia
5.4
/100
|
#227
Tragic
95.6%
Immigrants | Eastern Africa
5.1
/100
|
#228
Tragic
95.6%
Immigrants | Panama
4.9
/100
|
#229
Tragic
95.6%