Guyanese vs Immigrants from Netherlands 4th Grade

COMPARE

Guyanese
Race
Ancestry
AfghanAfricanAlaska NativeAlaskan AthabascanAlbanianAleutAlsatianAmericanApacheArabArapahoArgentineanArmenianAssyrian/Chaldean/SyriacAustralianAustrianBahamianBangladeshiBarbadianBasqueBelgianBelizeanBermudanBhutaneseBlackfeetBolivianBrazilianBritishBritish West IndianBulgarianBurmeseCajunCambodianCanadianCape VerdeanCarpatho RusynCelticCentral AmericanCentral American IndianCherokeeCheyenneChickasawChileanChineseChippewaChoctawColombianColvilleComancheCosta RicanCreeCreekCroatianCrowCubanCypriotCzechCzechoslovakianDanishDelawareDominicanDutchDutch West IndianEastern EuropeanEcuadorianEgyptianEnglishEstonianEthiopianEuropeanFijianFilipinoFinnishFrenchFrench American IndianFrench CanadianGermanGerman RussianGhanaianGreekGuamanian/ChamorroGuatemalanGuyaneseHaitianHmongHonduranHopiHoumaHungarianIcelanderIndian (Asian)IndonesianInupiatIranianIraqiIrishIroquoisIsraeliItalianJamaicanJapaneseJordanianKenyanKiowaKoreanLaotianLatvianLebaneseLiberianLithuanianLumbeeLuxembourgerMacedonianMalaysianMalteseMarshalleseMenomineeMexicanMexican American IndianMongolianMoroccanNative HawaiianNavajoNepaleseNew ZealanderNicaraguanNigerianNorthern EuropeanNorwegianOkinawanOsageOttawaPaiutePakistaniPalestinianPanamanianParaguayanPennsylvania GermanPeruvianPimaPolishPortuguesePotawatomiPuebloPuerto RicanPuget Sound SalishRomanianRussianSalvadoranSamoanScandinavianScotch-IrishScottishSeminoleSenegaleseSerbianShoshoneSierra LeoneanSiouxSlavicSlovakSloveneSomaliSouth AfricanSouth AmericanSouth American IndianSoviet UnionSpaniardSpanishSpanish AmericanSpanish American IndianSri LankanSubsaharan AfricanSudaneseSwedishSwissSyrianTaiwaneseThaiTlingit-HaidaTohono O'OdhamTonganTrinidadian and TobagonianTsimshianTurkishU.S. Virgin IslanderUgandanUkrainianUruguayanUteVenezuelanVietnameseWelshWest IndianYakamaYaquiYugoslavianYumanYup'ikZimbabwean
Immigration
NonimmigrantsImmigrantsAfghanistanAfricaAlbaniaArgentinaArmeniaAsiaAustraliaAustriaBahamasBangladeshBarbadosBelarusBelgiumBelizeBoliviaBosnia and HerzegovinaBrazilBulgariaBurma/MyanmarCabo VerdeCambodiaCameroonCanadaCaribbeanCentral AmericaChileChinaColombiaCongoCosta RicaCroatiaCubaCzechoslovakiaDenmarkDominicaDominican RepublicEastern AfricaEastern AsiaEastern EuropeEcuadorEgyptEl SalvadorEnglandEritreaEthiopiaEuropeFijiFranceGermanyGhanaGreeceGrenadaGuatemalaGuyanaHaitiHondurasHong KongHungaryIndiaIndonesiaIranIraqIrelandIsraelItalyJamaicaJapanJordanKazakhstanKenyaKoreaKuwaitLaosLatin AmericaLatviaLebanonLiberiaLithuaniaMalaysiaMexicoMicronesiaMiddle AfricaMoldovaMoroccoNepalNicaraguaNigeriaNorth AmericaNorth MacedoniaNorthern AfricaNorthern EuropeNorwayOceaniaPakistanPanamaPeruPhilippinesPolandPortugalRomaniaRussiaSaudi ArabiaScotlandSenegalSerbiaSierra LeoneSingaporeSomaliaSouth AfricaSouth AmericaSouth Central AsiaSouth Eastern AsiaSouthern EuropeSpainSri LankaSt. Vincent and the GrenadinesSudanSwedenSwitzerlandSyriaTaiwanThailandTrinidad and TobagoTurkeyUgandaUkraineUruguayUzbekistanVenezuelaVietnamWest IndiesWestern AfricaWestern AsiaWestern EuropeYemenZaireZimbabweAzores
Immigrants from Netherlands
Race
Ancestry
AfghanAfricanAlaska NativeAlaskan AthabascanAlbanianAleutAlsatianAmericanApacheArabArapahoArgentineanArmenianAssyrian/Chaldean/SyriacAustralianAustrianBahamianBangladeshiBarbadianBasqueBelgianBelizeanBermudanBhutaneseBlackfeetBolivianBrazilianBritishBritish West IndianBulgarianBurmeseCajunCambodianCanadianCape VerdeanCarpatho RusynCelticCentral AmericanCentral American IndianCherokeeCheyenneChickasawChileanChineseChippewaChoctawColombianColvilleComancheCosta RicanCreeCreekCroatianCrowCubanCypriotCzechCzechoslovakianDanishDelawareDominicanDutchDutch West IndianEastern EuropeanEcuadorianEgyptianEnglishEstonianEthiopianEuropeanFijianFilipinoFinnishFrenchFrench American IndianFrench CanadianGermanGerman RussianGhanaianGreekGuamanian/ChamorroGuatemalanHaitianHmongHonduranHopiHoumaHungarianIcelanderIndian (Asian)IndonesianInupiatIranianIraqiIrishIroquoisIsraeliItalianJamaicanJapaneseJordanianKenyanKiowaKoreanLaotianLatvianLebaneseLiberianLithuanianLumbeeLuxembourgerMacedonianMalaysianMalteseMarshalleseMenomineeMexicanMexican American IndianMongolianMoroccanNative HawaiianNavajoNepaleseNew ZealanderNicaraguanNigerianNorthern EuropeanNorwegianOkinawanOsageOttawaPaiutePakistaniPalestinianPanamanianParaguayanPennsylvania GermanPeruvianPimaPolishPortuguesePotawatomiPuebloPuerto RicanPuget Sound SalishRomanianRussianSalvadoranSamoanScandinavianScotch-IrishScottishSeminoleSenegaleseSerbianShoshoneSierra LeoneanSiouxSlavicSlovakSloveneSomaliSouth AfricanSouth AmericanSouth American IndianSoviet UnionSpaniardSpanishSpanish AmericanSpanish American IndianSri LankanSubsaharan AfricanSudaneseSwedishSwissSyrianTaiwaneseThaiTlingit-HaidaTohono O'OdhamTonganTrinidadian and TobagonianTsimshianTurkishU.S. Virgin IslanderUgandanUkrainianUruguayanUteVenezuelanVietnameseWelshWest IndianYakamaYaquiYugoslavianYumanYup'ikZimbabwean
Immigration
NonimmigrantsImmigrantsAfghanistanAfricaAlbaniaArgentinaArmeniaAsiaAustraliaAustriaBahamasBangladeshBarbadosBelarusBelgiumBelizeBoliviaBosnia and HerzegovinaBrazilBulgariaBurma/MyanmarCabo VerdeCambodiaCameroonCanadaCaribbeanCentral AmericaChileChinaColombiaCongoCosta RicaCroatiaCubaCzechoslovakiaDenmarkDominicaDominican RepublicEastern AfricaEastern AsiaEastern EuropeEcuadorEgyptEl SalvadorEnglandEritreaEthiopiaEuropeFijiFranceGermanyGhanaGreeceGrenadaGuatemalaGuyanaHaitiHondurasHong KongHungaryIndiaIndonesiaIranIraqIrelandIsraelItalyJamaicaJapanJordanKazakhstanKenyaKoreaKuwaitLaosLatin AmericaLatviaLebanonLiberiaLithuaniaMalaysiaMexicoMicronesiaMiddle AfricaMoldovaMoroccoNepalNetherlandsNicaraguaNigeriaNorth AmericaNorth MacedoniaNorthern AfricaNorthern EuropeNorwayOceaniaPakistanPanamaPeruPhilippinesPolandPortugalRomaniaRussiaSaudi ArabiaScotlandSenegalSerbiaSierra LeoneSingaporeSomaliaSouth AfricaSouth AmericaSouth Central AsiaSouth Eastern AsiaSouthern EuropeSpainSri LankaSt. Vincent and the GrenadinesSudanSwedenSwitzerlandSyriaTaiwanThailandTrinidad and TobagoTurkeyUgandaUkraineUruguayUzbekistanVenezuelaVietnamWest IndiesWestern AfricaWestern AsiaWestern EuropeYemenZaireZimbabweAzores
4th Grade
Income
Poverty
Unemployment
Labor Participation
Family Structure
Vehicle Availability
Education Level
Disability

4th Grade Comparison

Guyanese

Immigrants from Netherlands

Tragic
Exceptional
96.4%
4TH GRADE
0.0/ 100
METRIC RATING
303rd/ 347
METRIC RANK
98.0%
4TH GRADE
99.3/ 100
METRIC RATING
75th/ 347
METRIC RANK

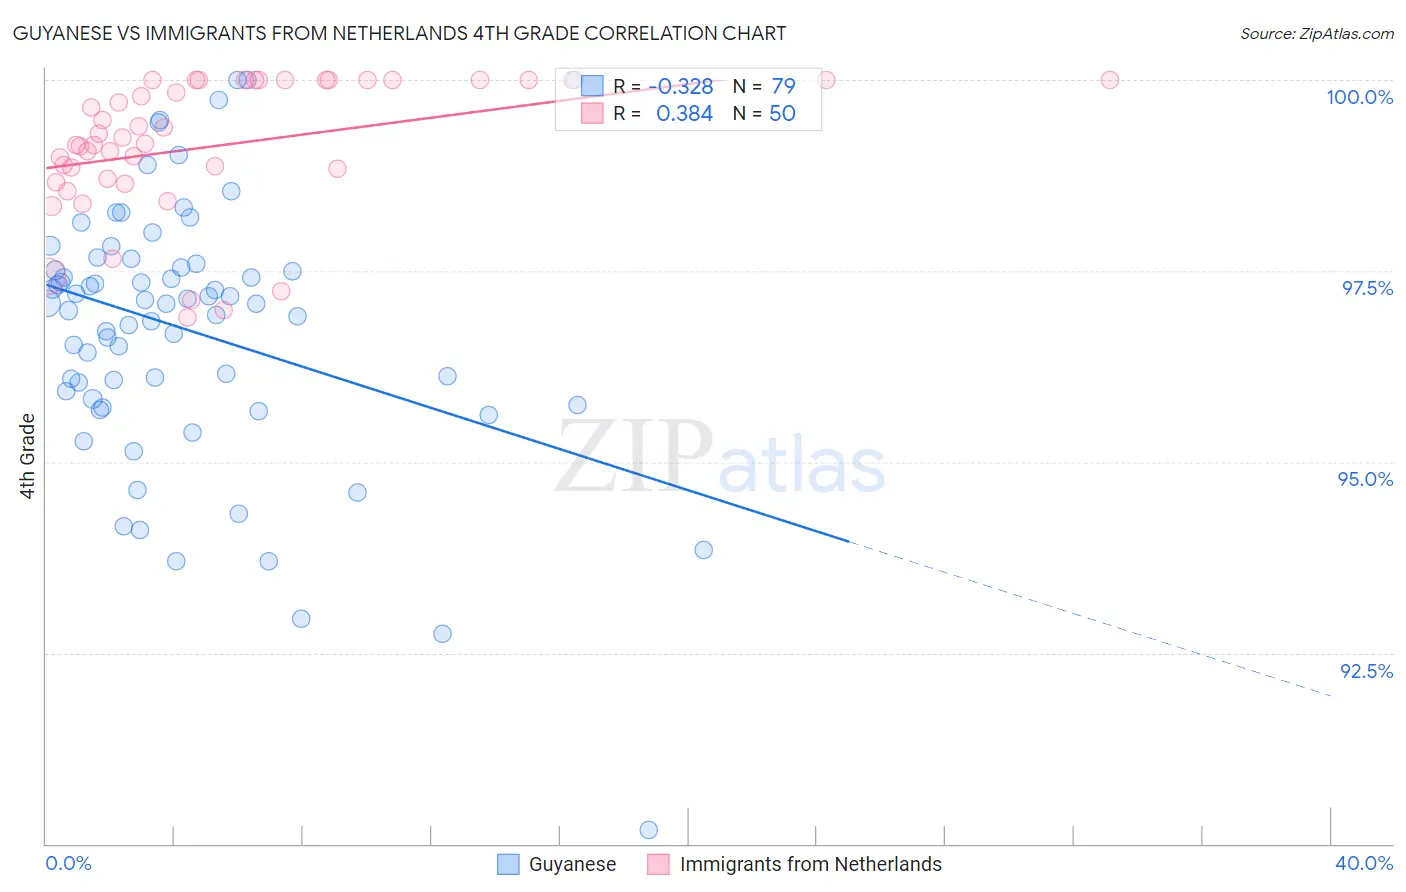
Guyanese vs Immigrants from Netherlands 4th Grade Correlation Chart

The statistical analysis conducted on geographies consisting of 176,921,765 people shows a mild negative correlation between the proportion of Guyanese and percentage of population with at least 4th grade education in the United States with a correlation coefficient (R) of -0.328 and weighted average of 96.4%. Similarly, the statistical analysis conducted on geographies consisting of 237,869,934 people shows a mild positive correlation between the proportion of Immigrants from Netherlands and percentage of population with at least 4th grade education in the United States with a correlation coefficient (R) of 0.384 and weighted average of 98.0%, a difference of 1.7%.
Guyanese vs Immigrants from Netherlands 4th Grade

4th Grade Correlation Summary

MeasurementGuyaneseImmigrants from Netherlands
Minimum90.2%96.9%
Maximum100.0%100.0%
Range9.8%3.1%
Mean96.7%99.1%
Median97.1%99.2%
Interquartile 25% (IQ1)95.8%98.7%
Interquartile 75% (IQ3)97.6%100.0%
Interquartile Range (IQR)1.8%1.3%
Standard Deviation (Sample)1.7%0.90%
Standard Deviation (Population)1.7%0.89%

Similar Demographics by 4th Grade

Demographics Similar to Guyanese by 4th Grade

In terms of 4th grade, the demographic groups most similar to Guyanese are Ecuadorian (96.4%, a difference of 0.010%), Immigrants from Caribbean (96.4%, a difference of 0.030%), Sri Lankan (96.4%, a difference of 0.040%), Immigrants from Cuba (96.4%, a difference of 0.050%), and Immigrants from Haiti (96.3%, a difference of 0.070%).
DemographicsRating | Rank4th Grade
Somalis
0.0
/100
|
#296
Tragic
96.6%
Immigrants | Somalia
0.0
/100
|
#297
Tragic
96.5%
Haitians
0.0
/100
|
#298
Tragic
96.5%
Immigrants | Dominica
0.0
/100
|
#299
Tragic
96.5%
Immigrants | South Eastern Asia
0.0
/100
|
#300
Tragic
96.5%
Immigrants | Immigrants
0.0
/100
|
#301
Tragic
96.5%
Immigrants | Cuba
0.0
/100
|
#302
Tragic
96.4%
Guyanese
0.0
/100
|
#303
Tragic
96.4%
Ecuadorians
0.0
/100
|
#304
Tragic
96.4%
Immigrants | Caribbean
0.0
/100
|
#305
Tragic
96.4%
Sri Lankans
0.0
/100
|
#306
Tragic
96.4%
Immigrants | Haiti
0.0
/100
|
#307
Tragic
96.3%
Immigrants | Laos
0.0
/100
|
#308
Tragic
96.3%
Immigrants | Guyana
0.0
/100
|
#309
Tragic
96.3%
Immigrants | Burma/Myanmar
0.0
/100
|
#310
Tragic
96.3%

Demographics Similar to Immigrants from Netherlands by 4th Grade

In terms of 4th grade, the demographic groups most similar to Immigrants from Netherlands are Cherokee (98.0%, a difference of 0.0%), Immigrants from Lithuania (98.0%, a difference of 0.0%), Chickasaw (98.0%, a difference of 0.010%), Immigrants from England (98.0%, a difference of 0.010%), and Ukrainian (98.0%, a difference of 0.010%).
DemographicsRating | Rank4th Grade
Kiowa
99.6
/100
|
#68
Exceptional
98.0%
Pueblo
99.6
/100
|
#69
Exceptional
98.0%
Immigrants | Austria
99.6
/100
|
#70
Exceptional
98.0%
Lumbee
99.6
/100
|
#71
Exceptional
98.0%
Iranians
99.4
/100
|
#72
Exceptional
98.0%
Macedonians
99.4
/100
|
#73
Exceptional
98.0%
Chickasaw
99.4
/100
|
#74
Exceptional
98.0%
Immigrants | Netherlands
99.3
/100
|
#75
Exceptional
98.0%
Cherokee
99.3
/100
|
#76
Exceptional
98.0%
Immigrants | Lithuania
99.3
/100
|
#77
Exceptional
98.0%
Immigrants | England
99.3
/100
|
#78
Exceptional
98.0%
Ukrainians
99.2
/100
|
#79
Exceptional
98.0%
Osage
99.2
/100
|
#80
Exceptional
98.0%
Immigrants | India
99.1
/100
|
#81
Exceptional
98.0%
Icelanders
99.1
/100
|
#82
Exceptional
98.0%