Guyanese vs Immigrants from Costa Rica 8th Grade
COMPARE
Guyanese
Immigrants from Costa Rica
8th Grade
8th Grade Comparison
Guyanese
Immigrants from Costa Rica
93.9%
8TH GRADE
0.0/ 100
METRIC RATING
304th/ 347
METRIC RANK
94.9%
8TH GRADE
0.5/ 100
METRIC RATING
261st/ 347
METRIC RANK
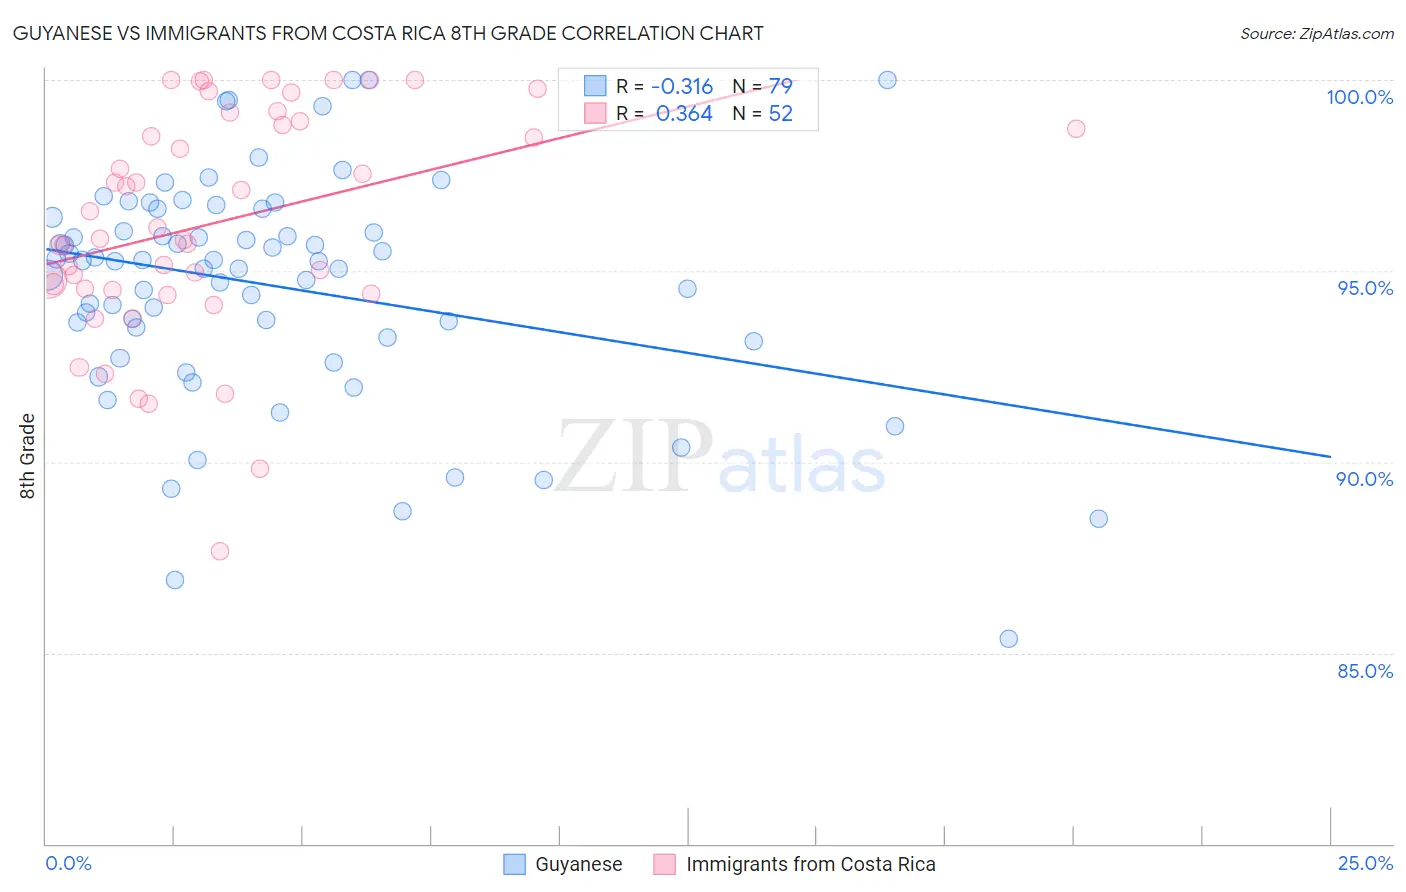
Guyanese vs Immigrants from Costa Rica 8th Grade Correlation Chart
The statistical analysis conducted on geographies consisting of 176,937,226 people shows a mild negative correlation between the proportion of Guyanese and percentage of population with at least 8th grade education in the United States with a correlation coefficient (R) of -0.316 and weighted average of 93.9%. Similarly, the statistical analysis conducted on geographies consisting of 204,277,408 people shows a mild positive correlation between the proportion of Immigrants from Costa Rica and percentage of population with at least 8th grade education in the United States with a correlation coefficient (R) of 0.364 and weighted average of 94.9%, a difference of 1.1%.
8th Grade Correlation Summary
| Measurement | Guyanese | Immigrants from Costa Rica |
| Minimum | 85.4% | 87.6% |
| Maximum | 100.0% | 100.0% |
| Range | 14.6% | 12.4% |
| Mean | 94.6% | 96.3% |
| Median | 95.3% | 96.0% |
| Interquartile 25% (IQ1) | 93.3% | 94.5% |
| Interquartile 75% (IQ3) | 96.4% | 98.9% |
| Interquartile Range (IQR) | 3.1% | 4.4% |
| Standard Deviation (Sample) | 2.9% | 3.0% |
| Standard Deviation (Population) | 2.9% | 2.9% |
Similar Demographics by 8th Grade
Demographics Similar to Guyanese by 8th Grade
In terms of 8th grade, the demographic groups most similar to Guyanese are Immigrants from Haiti (93.9%, a difference of 0.030%), Immigrants from Dominica (94.0%, a difference of 0.080%), Sri Lankan (94.0%, a difference of 0.13%), Immigrants from Guyana (93.8%, a difference of 0.13%), and Immigrants from Portugal (93.8%, a difference of 0.14%).
| Demographics | Rating | Rank | 8th Grade |
| Immigrants | South Eastern Asia | 0.0 /100 | #297 | Tragic 94.2% |
| Indonesians | 0.0 /100 | #298 | Tragic 94.1% |
| Cubans | 0.0 /100 | #299 | Tragic 94.1% |
| Immigrants | Burma/Myanmar | 0.0 /100 | #300 | Tragic 94.1% |
| Immigrants | Laos | 0.0 /100 | #301 | Tragic 94.1% |
| Sri Lankans | 0.0 /100 | #302 | Tragic 94.0% |
| Immigrants | Dominica | 0.0 /100 | #303 | Tragic 94.0% |
| Guyanese | 0.0 /100 | #304 | Tragic 93.9% |
| Immigrants | Haiti | 0.0 /100 | #305 | Tragic 93.9% |
| Immigrants | Guyana | 0.0 /100 | #306 | Tragic 93.8% |
| Immigrants | Portugal | 0.0 /100 | #307 | Tragic 93.8% |
| Ecuadorians | 0.0 /100 | #308 | Tragic 93.6% |
| Immigrants | Immigrants | 0.0 /100 | #309 | Tragic 93.6% |
| Japanese | 0.0 /100 | #310 | Tragic 93.6% |
| Immigrants | Bangladesh | 0.0 /100 | #311 | Tragic 93.6% |
Demographics Similar to Immigrants from Costa Rica by 8th Grade
In terms of 8th grade, the demographic groups most similar to Immigrants from Costa Rica are Immigrants from Nigeria (94.9%, a difference of 0.020%), Immigrants from Hong Kong (94.9%, a difference of 0.020%), South American (94.9%, a difference of 0.030%), Yuman (94.9%, a difference of 0.030%), and Immigrants from Congo (94.9%, a difference of 0.040%).
| Demographics | Rating | Rank | 8th Grade |
| Immigrants | Cameroon | 0.8 /100 | #254 | Tragic 95.0% |
| Immigrants | Somalia | 0.7 /100 | #255 | Tragic 95.0% |
| Colombians | 0.7 /100 | #256 | Tragic 95.0% |
| Afghans | 0.6 /100 | #257 | Tragic 94.9% |
| Immigrants | Congo | 0.6 /100 | #258 | Tragic 94.9% |
| Ghanaians | 0.6 /100 | #259 | Tragic 94.9% |
| Immigrants | Jamaica | 0.6 /100 | #260 | Tragic 94.9% |
| Immigrants | Costa Rica | 0.5 /100 | #261 | Tragic 94.9% |
| Immigrants | Nigeria | 0.4 /100 | #262 | Tragic 94.9% |
| Immigrants | Hong Kong | 0.4 /100 | #263 | Tragic 94.9% |
| South Americans | 0.4 /100 | #264 | Tragic 94.9% |
| Yuman | 0.4 /100 | #265 | Tragic 94.9% |
| West Indians | 0.3 /100 | #266 | Tragic 94.8% |
| Immigrants | Ghana | 0.3 /100 | #267 | Tragic 94.8% |
| Immigrants | Uruguay | 0.3 /100 | #268 | Tragic 94.8% |