German vs Celtic Associate's Degree
COMPARE
German
Celtic
Associate's Degree
Associate's Degree Comparison
Germans
Celtics
45.5%
ASSOCIATE'S DEGREE
26.5/ 100
METRIC RATING
195th/ 347
METRIC RANK
45.8%
ASSOCIATE'S DEGREE
33.3/ 100
METRIC RATING
192nd/ 347
METRIC RANK
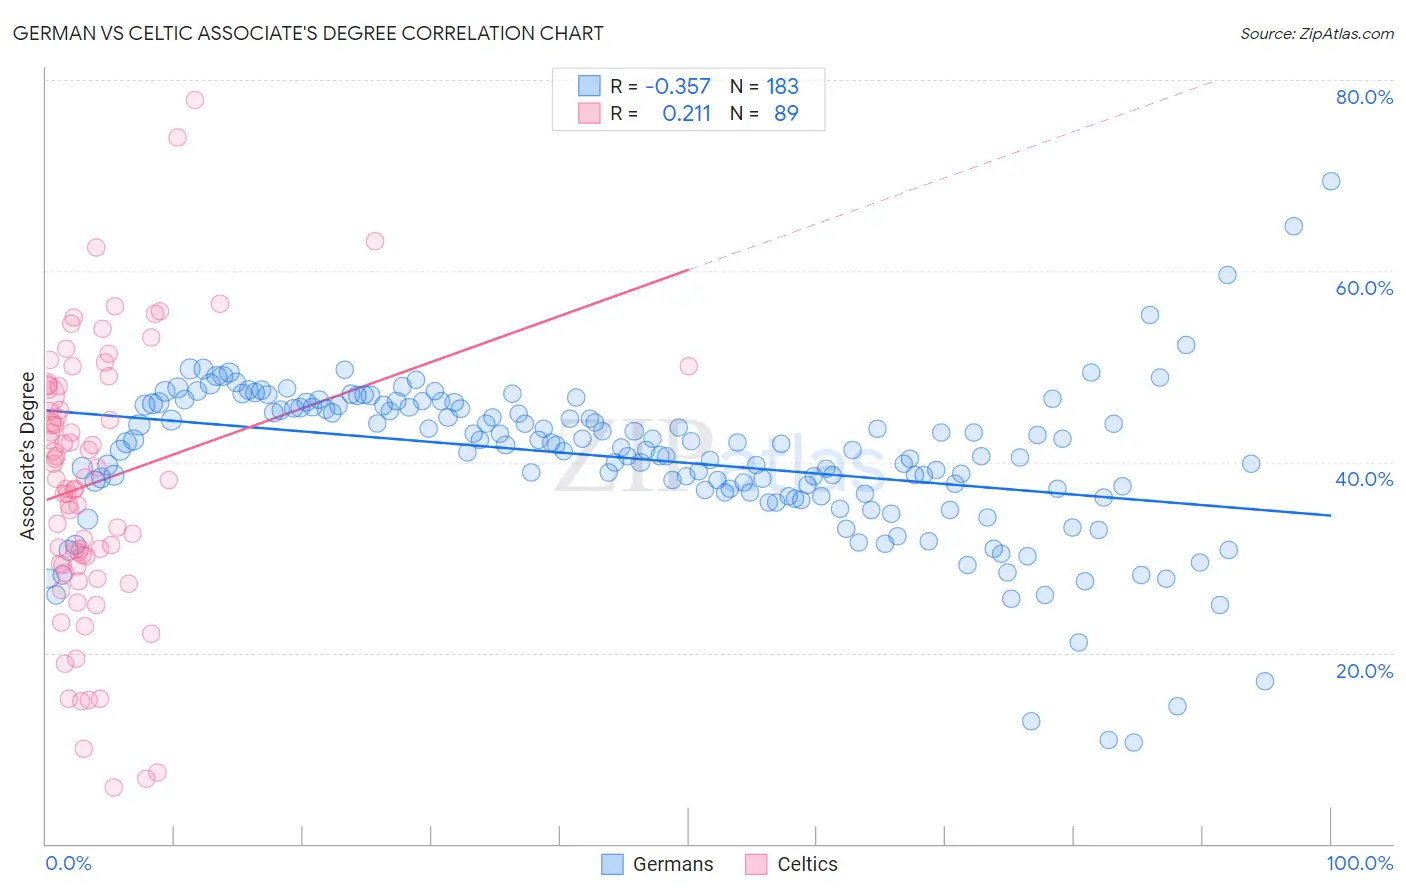
German vs Celtic Associate's Degree Correlation Chart
The statistical analysis conducted on geographies consisting of 581,143,634 people shows a mild negative correlation between the proportion of Germans and percentage of population with at least associate's degree education in the United States with a correlation coefficient (R) of -0.357 and weighted average of 45.5%. Similarly, the statistical analysis conducted on geographies consisting of 168,877,276 people shows a weak positive correlation between the proportion of Celtics and percentage of population with at least associate's degree education in the United States with a correlation coefficient (R) of 0.211 and weighted average of 45.8%, a difference of 0.62%.
Associate's Degree Correlation Summary
| Measurement | German | Celtic |
| Minimum | 10.6% | 5.9% |
| Maximum | 69.4% | 77.9% |
| Range | 58.8% | 72.0% |
| Mean | 40.3% | 37.9% |
| Median | 41.8% | 38.3% |
| Interquartile 25% (IQ1) | 36.7% | 29.3% |
| Interquartile 75% (IQ3) | 45.9% | 47.8% |
| Interquartile Range (IQR) | 9.2% | 18.5% |
| Standard Deviation (Sample) | 8.3% | 14.1% |
| Standard Deviation (Population) | 8.3% | 14.0% |
Demographics Similar to Germans and Celtics by Associate's Degree
In terms of associate's degree, the demographic groups most similar to Germans are French (45.4%, a difference of 0.090%), Immigrants from Peru (45.5%, a difference of 0.10%), Immigrants from Cameroon (45.7%, a difference of 0.42%), Scotch-Irish (45.3%, a difference of 0.44%), and Immigrants from Bangladesh (45.2%, a difference of 0.54%). Similarly, the demographic groups most similar to Celtics are Korean (45.8%, a difference of 0.050%), Vietnamese (45.8%, a difference of 0.060%), Immigrants from Oceania (45.8%, a difference of 0.12%), Immigrants from Uruguay (45.8%, a difference of 0.18%), and Ghanaian (45.8%, a difference of 0.18%).
| Demographics | Rating | Rank | Associate's Degree |
| Yugoslavians | 40.2 /100 | #183 | Average 46.0% |
| Czechoslovakians | 40.0 /100 | #184 | Average 46.0% |
| Costa Ricans | 38.6 /100 | #185 | Fair 46.0% |
| Welsh | 37.9 /100 | #186 | Fair 45.9% |
| Immigrants | Uruguay | 35.5 /100 | #187 | Fair 45.8% |
| Ghanaians | 35.5 /100 | #188 | Fair 45.8% |
| Immigrants | Oceania | 34.7 /100 | #189 | Fair 45.8% |
| Vietnamese | 34.0 /100 | #190 | Fair 45.8% |
| Koreans | 33.8 /100 | #191 | Fair 45.8% |
| Celtics | 33.3 /100 | #192 | Fair 45.8% |
| Immigrants | Cameroon | 31.0 /100 | #193 | Fair 45.7% |
| Immigrants | Peru | 27.6 /100 | #194 | Fair 45.5% |
| Germans | 26.5 /100 | #195 | Fair 45.5% |
| French | 25.6 /100 | #196 | Fair 45.4% |
| Scotch-Irish | 22.3 /100 | #197 | Fair 45.3% |
| Immigrants | Bangladesh | 21.3 /100 | #198 | Fair 45.2% |
| Immigrants | Senegal | 21.2 /100 | #199 | Fair 45.2% |
| Senegalese | 21.1 /100 | #200 | Fair 45.2% |
| Immigrants | Vietnam | 20.8 /100 | #201 | Fair 45.2% |
| Spaniards | 20.4 /100 | #202 | Fair 45.2% |
| Immigrants | South Eastern Asia | 20.2 /100 | #203 | Fair 45.2% |