German Russian vs Immigrants from Kazakhstan Bachelor's Degree

COMPARE

German Russian
Race
Ancestry
AfghanAfricanAlaska NativeAlaskan AthabascanAlbanianAleutAlsatianAmericanApacheArabArapahoArgentineanArmenianAssyrian/Chaldean/SyriacAustralianAustrianBahamianBangladeshiBarbadianBasqueBelgianBelizeanBermudanBhutaneseBlackfeetBolivianBrazilianBritishBritish West IndianBulgarianBurmeseCajunCambodianCanadianCape VerdeanCarpatho RusynCelticCentral AmericanCentral American IndianCherokeeCheyenneChickasawChileanChineseChippewaChoctawColombianColvilleComancheCosta RicanCreeCreekCroatianCrowCubanCypriotCzechCzechoslovakianDanishDelawareDominicanDutchDutch West IndianEastern EuropeanEcuadorianEgyptianEnglishEstonianEthiopianEuropeanFijianFilipinoFinnishFrenchFrench American IndianFrench CanadianGermanGerman RussianGhanaianGreekGuamanian/ChamorroGuatemalanGuyaneseHaitianHmongHonduranHopiHoumaHungarianIcelanderIndian (Asian)IndonesianInupiatIranianIraqiIrishIroquoisIsraeliItalianJamaicanJapaneseJordanianKenyanKiowaKoreanLaotianLatvianLebaneseLiberianLithuanianLumbeeLuxembourgerMacedonianMalaysianMalteseMarshalleseMenomineeMexicanMexican American IndianMongolianMoroccanNative HawaiianNavajoNepaleseNew ZealanderNicaraguanNigerianNorthern EuropeanNorwegianOkinawanOsageOttawaPaiutePakistaniPalestinianPanamanianParaguayanPennsylvania GermanPeruvianPimaPolishPortuguesePotawatomiPuebloPuerto RicanPuget Sound SalishRomanianRussianSalvadoranSamoanScandinavianScotch-IrishScottishSeminoleSenegaleseSerbianShoshoneSierra LeoneanSiouxSlavicSlovakSloveneSomaliSouth AfricanSouth AmericanSouth American IndianSoviet UnionSpaniardSpanishSpanish AmericanSpanish American IndianSri LankanSubsaharan AfricanSudaneseSwedishSwissSyrianTaiwaneseThaiTlingit-HaidaTohono O'OdhamTonganTrinidadian and TobagonianTsimshianTurkishU.S. Virgin IslanderUgandanUkrainianUruguayanUteVenezuelanVietnameseWelshWest IndianYakamaYaquiYugoslavianYumanYup'ikZimbabwean
Immigration
NonimmigrantsImmigrantsAfghanistanAfricaAlbaniaArgentinaArmeniaAsiaAustraliaAustriaBahamasBangladeshBarbadosBelarusBelgiumBelizeBoliviaBosnia and HerzegovinaBrazilBulgariaBurma/MyanmarCabo VerdeCambodiaCameroonCanadaCaribbeanCentral AmericaChileChinaColombiaCongoCosta RicaCroatiaCubaCzechoslovakiaDenmarkDominicaDominican RepublicEastern AfricaEastern AsiaEastern EuropeEcuadorEgyptEl SalvadorEnglandEritreaEthiopiaEuropeFijiFranceGermanyGhanaGreeceGrenadaGuatemalaGuyanaHaitiHondurasHong KongHungaryIndiaIndonesiaIranIraqIrelandIsraelItalyJamaicaJapanJordanKenyaKoreaKuwaitLaosLatin AmericaLatviaLebanonLiberiaLithuaniaMalaysiaMexicoMicronesiaMiddle AfricaMoldovaMoroccoNepalNetherlandsNicaraguaNigeriaNorth AmericaNorth MacedoniaNorthern AfricaNorthern EuropeNorwayOceaniaPakistanPanamaPeruPhilippinesPolandPortugalRomaniaRussiaSaudi ArabiaScotlandSenegalSerbiaSierra LeoneSingaporeSomaliaSouth AfricaSouth AmericaSouth Central AsiaSouth Eastern AsiaSouthern EuropeSpainSri LankaSt. Vincent and the GrenadinesSudanSwedenSwitzerlandSyriaTaiwanThailandTrinidad and TobagoTurkeyUgandaUkraineUruguayUzbekistanVenezuelaVietnamWest IndiesWestern AfricaWestern AsiaWestern EuropeYemenZaireZimbabweAzores
Immigrants from Kazakhstan
Race
Ancestry
AfghanAfricanAlaska NativeAlaskan AthabascanAlbanianAleutAlsatianAmericanApacheArabArapahoArgentineanArmenianAssyrian/Chaldean/SyriacAustralianAustrianBahamianBangladeshiBarbadianBasqueBelgianBelizeanBermudanBhutaneseBlackfeetBolivianBrazilianBritishBritish West IndianBulgarianBurmeseCajunCambodianCanadianCape VerdeanCarpatho RusynCelticCentral AmericanCentral American IndianCherokeeCheyenneChickasawChileanChineseChippewaChoctawColombianColvilleComancheCosta RicanCreeCreekCroatianCrowCubanCypriotCzechCzechoslovakianDanishDelawareDominicanDutchDutch West IndianEastern EuropeanEcuadorianEgyptianEnglishEstonianEthiopianEuropeanFijianFilipinoFinnishFrenchFrench American IndianFrench CanadianGermanGhanaianGreekGuamanian/ChamorroGuatemalanGuyaneseHaitianHmongHonduranHopiHoumaHungarianIcelanderIndian (Asian)IndonesianInupiatIranianIraqiIrishIroquoisIsraeliItalianJamaicanJapaneseJordanianKenyanKiowaKoreanLaotianLatvianLebaneseLiberianLithuanianLumbeeLuxembourgerMacedonianMalaysianMalteseMarshalleseMenomineeMexicanMexican American IndianMongolianMoroccanNative HawaiianNavajoNepaleseNew ZealanderNicaraguanNigerianNorthern EuropeanNorwegianOkinawanOsageOttawaPaiutePakistaniPalestinianPanamanianParaguayanPennsylvania GermanPeruvianPimaPolishPortuguesePotawatomiPuebloPuerto RicanPuget Sound SalishRomanianRussianSalvadoranSamoanScandinavianScotch-IrishScottishSeminoleSenegaleseSerbianShoshoneSierra LeoneanSiouxSlavicSlovakSloveneSomaliSouth AfricanSouth AmericanSouth American IndianSoviet UnionSpaniardSpanishSpanish AmericanSpanish American IndianSri LankanSubsaharan AfricanSudaneseSwedishSwissSyrianTaiwaneseThaiTlingit-HaidaTohono O'OdhamTonganTrinidadian and TobagonianTsimshianTurkishU.S. Virgin IslanderUgandanUkrainianUruguayanUteVenezuelanVietnameseWelshWest IndianYakamaYaquiYugoslavianYumanYup'ikZimbabwean
Immigration
NonimmigrantsImmigrantsAfghanistanAfricaAlbaniaArgentinaArmeniaAsiaAustraliaAustriaBahamasBangladeshBarbadosBelarusBelgiumBelizeBoliviaBosnia and HerzegovinaBrazilBulgariaBurma/MyanmarCabo VerdeCambodiaCameroonCanadaCaribbeanCentral AmericaChileChinaColombiaCongoCosta RicaCroatiaCubaCzechoslovakiaDenmarkDominicaDominican RepublicEastern AfricaEastern AsiaEastern EuropeEcuadorEgyptEl SalvadorEnglandEritreaEthiopiaEuropeFijiFranceGermanyGhanaGreeceGrenadaGuatemalaGuyanaHaitiHondurasHong KongHungaryIndiaIndonesiaIranIraqIrelandIsraelItalyJamaicaJapanJordanKazakhstanKenyaKoreaKuwaitLaosLatin AmericaLatviaLebanonLiberiaLithuaniaMalaysiaMexicoMicronesiaMiddle AfricaMoldovaMoroccoNepalNetherlandsNicaraguaNigeriaNorth AmericaNorth MacedoniaNorthern AfricaNorthern EuropeNorwayOceaniaPakistanPanamaPeruPhilippinesPolandPortugalRomaniaRussiaSaudi ArabiaScotlandSenegalSerbiaSierra LeoneSingaporeSomaliaSouth AfricaSouth AmericaSouth Central AsiaSouth Eastern AsiaSouthern EuropeSpainSri LankaSt. Vincent and the GrenadinesSudanSwedenSwitzerlandSyriaTaiwanThailandTrinidad and TobagoTurkeyUgandaUkraineUruguayUzbekistanVenezuelaVietnamWest IndiesWestern AfricaWestern AsiaWestern EuropeYemenZaireZimbabweAzores
Bachelor's Degree
Income
Poverty
Unemployment
Labor Participation
Family Structure
Vehicle Availability
Education Level
Disability

Bachelor's Degree Comparison

German Russians

Immigrants from Kazakhstan

Poor
Exceptional
35.8%
BACHELOR'S DEGREE
10.2/ 100
METRIC RATING
217th/ 347
METRIC RANK
43.4%
BACHELOR'S DEGREE
99.8/ 100
METRIC RATING
62nd/ 347
METRIC RANK

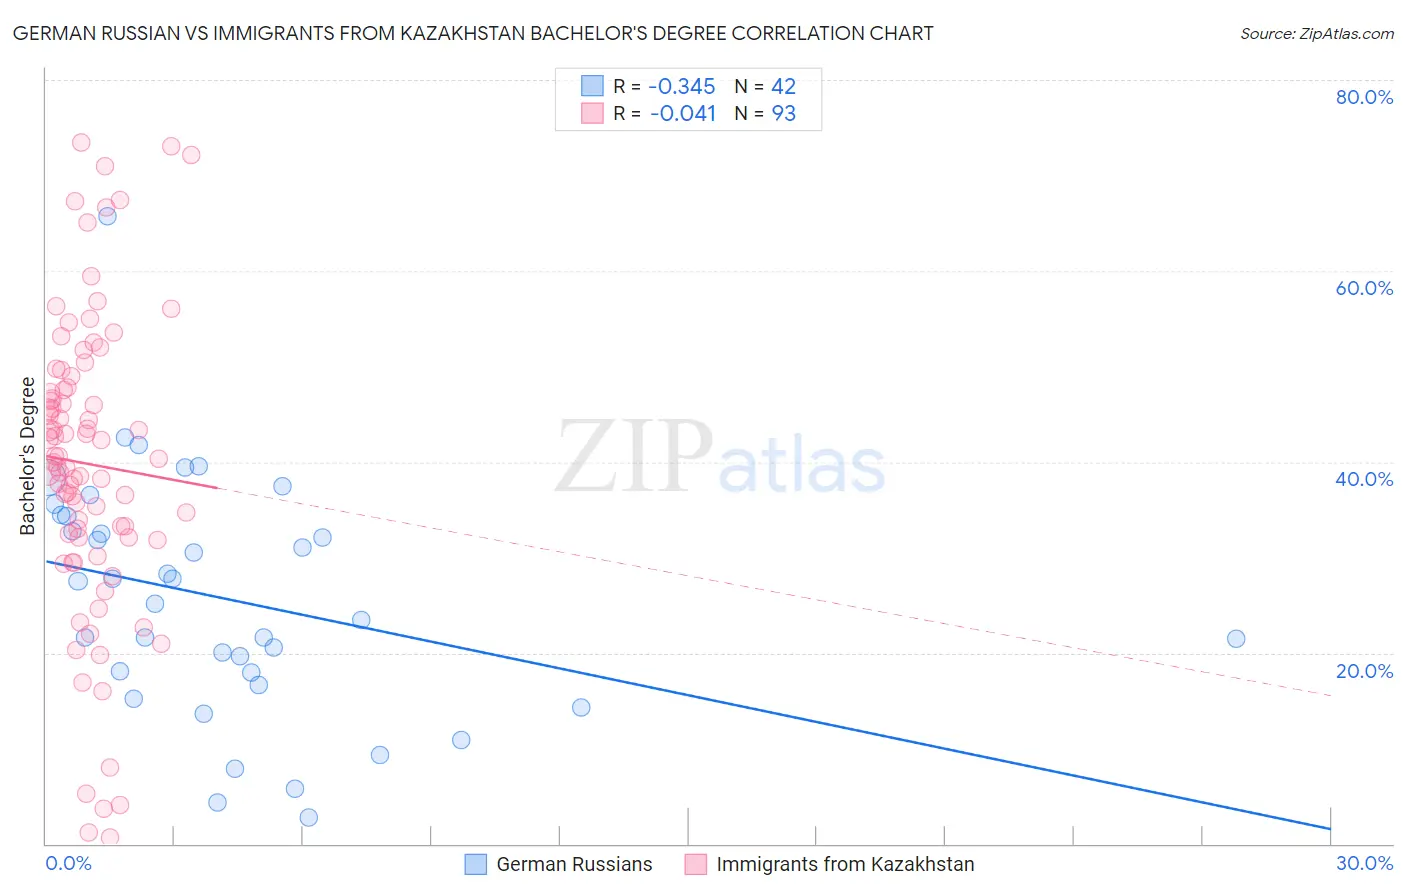
German Russian vs Immigrants from Kazakhstan Bachelor's Degree Correlation Chart

The statistical analysis conducted on geographies consisting of 96,460,010 people shows a mild negative correlation between the proportion of German Russians and percentage of population with at least bachelor's degree education in the United States with a correlation coefficient (R) of -0.345 and weighted average of 35.8%. Similarly, the statistical analysis conducted on geographies consisting of 124,444,388 people shows no correlation between the proportion of Immigrants from Kazakhstan and percentage of population with at least bachelor's degree education in the United States with a correlation coefficient (R) of -0.041 and weighted average of 43.4%, a difference of 21.2%.
German Russian vs Immigrants from Kazakhstan Bachelor's Degree

Bachelor's Degree Correlation Summary

MeasurementGerman RussianImmigrants from Kazakhstan
Minimum2.8%0.64%
Maximum65.8%73.4%
Range63.0%72.8%
Mean25.7%39.8%
Median26.4%40.4%
Interquartile 25% (IQ1)18.0%32.1%
Interquartile 75% (IQ3)34.3%48.4%
Interquartile Range (IQR)16.3%16.4%
Standard Deviation (Sample)12.5%15.8%
Standard Deviation (Population)12.3%15.7%

Similar Demographics by Bachelor's Degree

Demographics Similar to German Russians by Bachelor's Degree

In terms of bachelor's degree, the demographic groups most similar to German Russians are Subsaharan African (35.8%, a difference of 0.10%), West Indian (35.8%, a difference of 0.13%), Spanish (35.8%, a difference of 0.17%), Dutch (35.7%, a difference of 0.28%), and Trinidadian and Tobagonian (35.7%, a difference of 0.42%).
DemographicsRating | RankBachelor's Degree
French
18.6
/100
|
#210
Poor
36.5%
Scotch-Irish
18.3
/100
|
#211
Poor
36.4%
Immigrants | Philippines
17.8
/100
|
#212
Poor
36.4%
Immigrants | Panama
14.2
/100
|
#213
Poor
36.2%
Germans
13.9
/100
|
#214
Poor
36.1%
Immigrants | Western Africa
13.8
/100
|
#215
Poor
36.1%
Barbadians
13.5
/100
|
#216
Poor
36.1%
German Russians
10.2
/100
|
#217
Poor
35.8%
Sub-Saharan Africans
9.8
/100
|
#218
Tragic
35.8%
West Indians
9.7
/100
|
#219
Tragic
35.8%
Spanish
9.6
/100
|
#220
Tragic
35.8%
Dutch
9.2
/100
|
#221
Tragic
35.7%
Trinidadians and Tobagonians
8.8
/100
|
#222
Tragic
35.7%
French Canadians
8.3
/100
|
#223
Tragic
35.6%
Immigrants | Barbados
7.5
/100
|
#224
Tragic
35.5%

Demographics Similar to Immigrants from Kazakhstan by Bachelor's Degree

In terms of bachelor's degree, the demographic groups most similar to Immigrants from Kazakhstan are Immigrants from Europe (43.4%, a difference of 0.050%), South African (43.6%, a difference of 0.30%), Argentinean (43.3%, a difference of 0.32%), Zimbabwean (43.3%, a difference of 0.32%), and Immigrants from Netherlands (43.3%, a difference of 0.35%).
DemographicsRating | RankBachelor's Degree
Immigrants | Bolivia
99.9
/100
|
#55
Exceptional
44.2%
Immigrants | Serbia
99.9
/100
|
#56
Exceptional
44.1%
Paraguayans
99.9
/100
|
#57
Exceptional
44.0%
Immigrants | Czechoslovakia
99.9
/100
|
#58
Exceptional
44.0%
Australians
99.9
/100
|
#59
Exceptional
44.0%
New Zealanders
99.9
/100
|
#60
Exceptional
44.0%
South Africans
99.8
/100
|
#61
Exceptional
43.6%
Immigrants | Kazakhstan
99.8
/100
|
#62
Exceptional
43.4%
Immigrants | Europe
99.8
/100
|
#63
Exceptional
43.4%
Argentineans
99.7
/100
|
#64
Exceptional
43.3%
Zimbabweans
99.7
/100
|
#65
Exceptional
43.3%
Immigrants | Netherlands
99.7
/100
|
#66
Exceptional
43.3%
Egyptians
99.7
/100
|
#67
Exceptional
43.3%
Immigrants | Indonesia
99.7
/100
|
#68
Exceptional
43.3%
Immigrants | Pakistan
99.7
/100
|
#69
Exceptional
43.1%