German Russian vs Bolivian 11th Grade
COMPARE
German Russian
Bolivian
11th Grade
11th Grade Comparison
German Russians
Bolivians
93.3%
11TH GRADE
96.4/ 100
METRIC RATING
121st/ 347
METRIC RANK
92.2%
11TH GRADE
23.2/ 100
METRIC RATING
206th/ 347
METRIC RANK
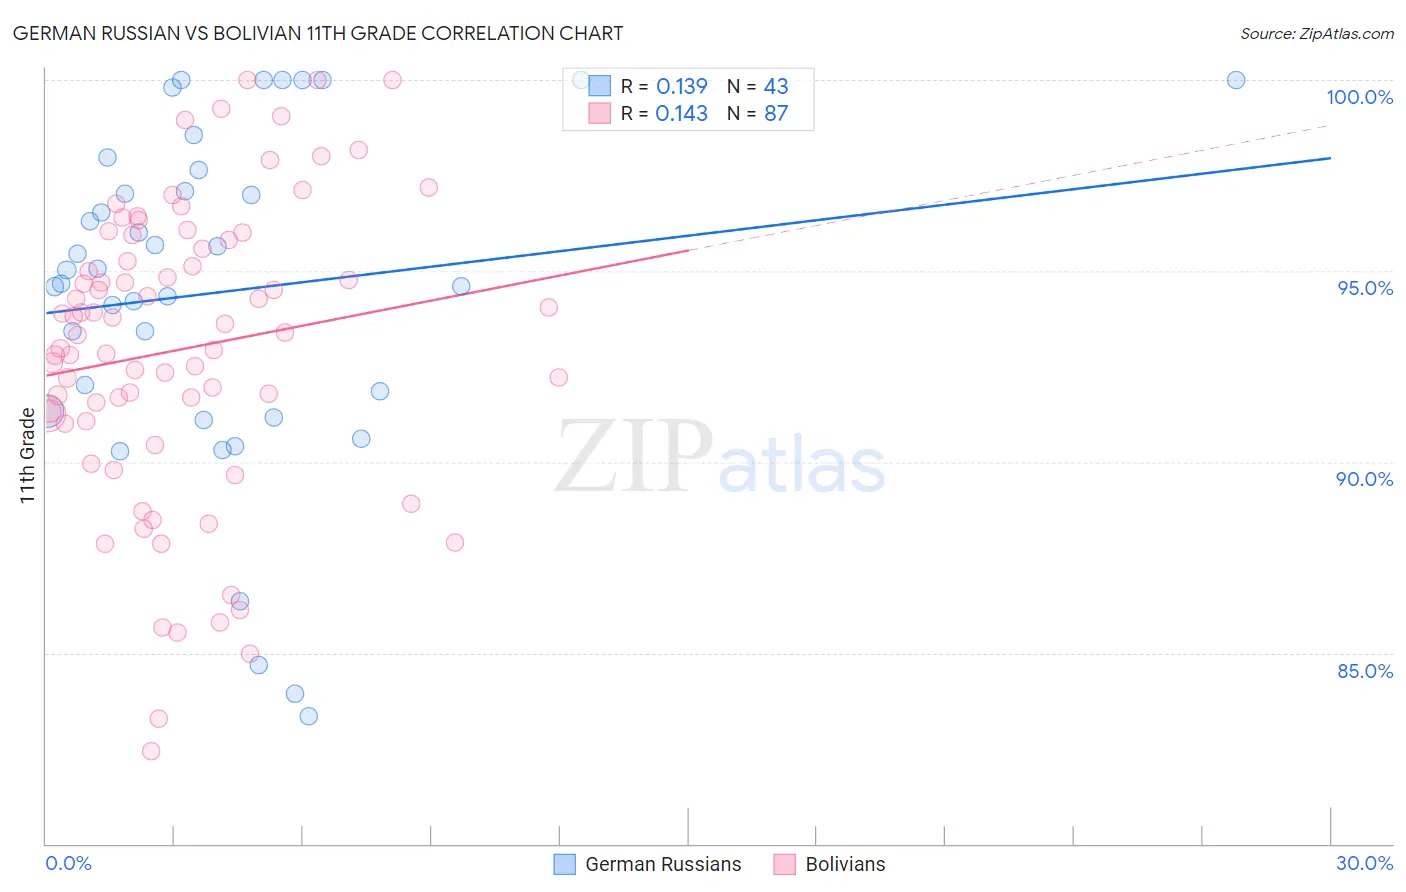
German Russian vs Bolivian 11th Grade Correlation Chart
The statistical analysis conducted on geographies consisting of 96,461,984 people shows a poor positive correlation between the proportion of German Russians and percentage of population with at least 11th grade education in the United States with a correlation coefficient (R) of 0.139 and weighted average of 93.3%. Similarly, the statistical analysis conducted on geographies consisting of 184,666,822 people shows a poor positive correlation between the proportion of Bolivians and percentage of population with at least 11th grade education in the United States with a correlation coefficient (R) of 0.143 and weighted average of 92.2%, a difference of 1.1%.
11th Grade Correlation Summary
| Measurement | German Russian | Bolivian |
| Minimum | 83.3% | 82.4% |
| Maximum | 100.0% | 100.0% |
| Range | 16.7% | 17.6% |
| Mean | 94.5% | 93.0% |
| Median | 95.0% | 93.4% |
| Interquartile 25% (IQ1) | 91.3% | 91.1% |
| Interquartile 75% (IQ3) | 97.6% | 95.8% |
| Interquartile Range (IQR) | 6.3% | 4.7% |
| Standard Deviation (Sample) | 4.4% | 3.9% |
| Standard Deviation (Population) | 4.4% | 3.9% |
Similar Demographics by 11th Grade
Demographics Similar to German Russians by 11th Grade
In terms of 11th grade, the demographic groups most similar to German Russians are Immigrants from Belarus (93.3%, a difference of 0.0%), Immigrants from Russia (93.3%, a difference of 0.020%), Immigrants from Greece (93.2%, a difference of 0.030%), Immigrants from Eastern Europe (93.2%, a difference of 0.030%), and Immigrants from Korea (93.3%, a difference of 0.050%).
| Demographics | Rating | Rank | 11th Grade |
| Jordanians | 97.8 /100 | #114 | Exceptional 93.4% |
| Palestinians | 97.7 /100 | #115 | Exceptional 93.4% |
| Immigrants | Hungary | 97.5 /100 | #116 | Exceptional 93.4% |
| Whites/Caucasians | 97.4 /100 | #117 | Exceptional 93.3% |
| Immigrants | Korea | 97.0 /100 | #118 | Exceptional 93.3% |
| Israelis | 97.0 /100 | #119 | Exceptional 93.3% |
| Immigrants | Russia | 96.6 /100 | #120 | Exceptional 93.3% |
| German Russians | 96.4 /100 | #121 | Exceptional 93.3% |
| Immigrants | Belarus | 96.3 /100 | #122 | Exceptional 93.3% |
| Immigrants | Greece | 95.9 /100 | #123 | Exceptional 93.2% |
| Immigrants | Eastern Europe | 95.9 /100 | #124 | Exceptional 93.2% |
| Immigrants | Sri Lanka | 95.6 /100 | #125 | Exceptional 93.2% |
| Basques | 95.2 /100 | #126 | Exceptional 93.2% |
| Immigrants | Kazakhstan | 92.4 /100 | #127 | Exceptional 93.1% |
| Immigrants | Jordan | 92.4 /100 | #128 | Exceptional 93.1% |
Demographics Similar to Bolivians by 11th Grade
In terms of 11th grade, the demographic groups most similar to Bolivians are Immigrants from Sudan (92.3%, a difference of 0.0%), Immigrants from Hong Kong (92.2%, a difference of 0.0%), Kiowa (92.2%, a difference of 0.0%), Immigrants from Eastern Africa (92.3%, a difference of 0.010%), and Immigrants from Oceania (92.2%, a difference of 0.010%).
| Demographics | Rating | Rank | 11th Grade |
| Immigrants | Uganda | 25.2 /100 | #199 | Fair 92.3% |
| Samoans | 25.1 /100 | #200 | Fair 92.3% |
| Immigrants | China | 25.1 /100 | #201 | Fair 92.3% |
| Immigrants | Eastern Africa | 24.1 /100 | #202 | Fair 92.3% |
| Immigrants | Sudan | 23.5 /100 | #203 | Fair 92.3% |
| Immigrants | Hong Kong | 23.3 /100 | #204 | Fair 92.2% |
| Kiowa | 23.2 /100 | #205 | Fair 92.2% |
| Bolivians | 23.2 /100 | #206 | Fair 92.2% |
| Immigrants | Oceania | 22.4 /100 | #207 | Fair 92.2% |
| Colville | 21.8 /100 | #208 | Fair 92.2% |
| Tongans | 19.8 /100 | #209 | Poor 92.2% |
| Ethiopians | 18.8 /100 | #210 | Poor 92.2% |
| Immigrants | Micronesia | 17.7 /100 | #211 | Poor 92.2% |
| Koreans | 14.4 /100 | #212 | Poor 92.1% |
| Immigrants | Ethiopia | 13.9 /100 | #213 | Poor 92.1% |