French vs Burmese 8th Grade

COMPARE

French
Race
Ancestry
AfghanAfricanAlaska NativeAlaskan AthabascanAlbanianAleutAlsatianAmericanApacheArabArapahoArgentineanArmenianAssyrian/Chaldean/SyriacAustralianAustrianBahamianBangladeshiBarbadianBasqueBelgianBelizeanBermudanBhutaneseBlackfeetBolivianBrazilianBritishBritish West IndianBulgarianCajunCambodianCanadianCape VerdeanCarpatho RusynCelticCentral AmericanCentral American IndianCherokeeCheyenneChickasawChileanChineseChippewaChoctawColombianColvilleComancheCosta RicanCreeCreekCroatianCrowCubanCypriotCzechCzechoslovakianDanishDelawareDominicanDutchDutch West IndianEastern EuropeanEcuadorianEgyptianEnglishEstonianEthiopianEuropeanFijianFilipinoFinnishFrenchFrench American IndianFrench CanadianGermanGerman RussianGhanaianGreekGuamanian/ChamorroGuatemalanGuyaneseHaitianHmongHonduranHopiHoumaHungarianIcelanderIndian (Asian)IndonesianInupiatIranianIraqiIrishIroquoisIsraeliItalianJamaicanJapaneseJordanianKenyanKiowaKoreanLaotianLatvianLebaneseLiberianLithuanianLumbeeLuxembourgerMacedonianMalaysianMalteseMarshalleseMenomineeMexicanMexican American IndianMongolianMoroccanNative HawaiianNavajoNepaleseNew ZealanderNicaraguanNigerianNorthern EuropeanNorwegianOkinawanOsageOttawaPaiutePakistaniPalestinianPanamanianParaguayanPennsylvania GermanPeruvianPimaPolishPortuguesePotawatomiPuebloPuerto RicanPuget Sound SalishRomanianRussianSalvadoranSamoanScandinavianScotch-IrishScottishSeminoleSenegaleseSerbianShoshoneSierra LeoneanSiouxSlavicSlovakSloveneSomaliSouth AfricanSouth AmericanSouth American IndianSoviet UnionSpaniardSpanishSpanish AmericanSpanish American IndianSri LankanSubsaharan AfricanSudaneseSwedishSwissSyrianTaiwaneseThaiTlingit-HaidaTohono O'OdhamTonganTrinidadian and TobagonianTsimshianTurkishU.S. Virgin IslanderUgandanUkrainianUruguayanUteVenezuelanVietnameseWelshWest IndianYakamaYaquiYugoslavianYumanYup'ikZimbabwean
Immigration
NonimmigrantsImmigrantsAfghanistanAfricaAlbaniaArgentinaArmeniaAsiaAustraliaAustriaBahamasBangladeshBarbadosBelarusBelgiumBelizeBoliviaBosnia and HerzegovinaBrazilBulgariaBurma/MyanmarCabo VerdeCambodiaCameroonCanadaCaribbeanCentral AmericaChileChinaColombiaCongoCosta RicaCroatiaCubaCzechoslovakiaDenmarkDominicaDominican RepublicEastern AfricaEastern AsiaEastern EuropeEcuadorEgyptEl SalvadorEnglandEritreaEthiopiaEuropeFijiFranceGermanyGhanaGreeceGrenadaGuatemalaGuyanaHaitiHondurasHong KongHungaryIndiaIndonesiaIranIraqIrelandIsraelItalyJamaicaJapanJordanKazakhstanKenyaKoreaKuwaitLaosLatin AmericaLatviaLebanonLiberiaLithuaniaMalaysiaMexicoMicronesiaMiddle AfricaMoldovaMoroccoNepalNetherlandsNicaraguaNigeriaNorth AmericaNorth MacedoniaNorthern AfricaNorthern EuropeNorwayOceaniaPakistanPanamaPeruPhilippinesPolandPortugalRomaniaRussiaSaudi ArabiaScotlandSenegalSerbiaSierra LeoneSingaporeSomaliaSouth AfricaSouth AmericaSouth Central AsiaSouth Eastern AsiaSouthern EuropeSpainSri LankaSt. Vincent and the GrenadinesSudanSwedenSwitzerlandSyriaTaiwanThailandTrinidad and TobagoTurkeyUgandaUkraineUruguayUzbekistanVenezuelaVietnamWest IndiesWestern AfricaWestern AsiaWestern EuropeYemenZaireZimbabweAzores
Burmese
Race
Ancestry
AfghanAfricanAlaska NativeAlaskan AthabascanAlbanianAleutAlsatianAmericanApacheArabArapahoArgentineanArmenianAssyrian/Chaldean/SyriacAustralianAustrianBahamianBangladeshiBarbadianBasqueBelgianBelizeanBermudanBhutaneseBlackfeetBolivianBrazilianBritishBritish West IndianBulgarianBurmeseCajunCambodianCanadianCape VerdeanCarpatho RusynCelticCentral AmericanCentral American IndianCherokeeCheyenneChickasawChileanChineseChippewaChoctawColombianColvilleComancheCosta RicanCreeCreekCroatianCrowCubanCypriotCzechCzechoslovakianDanishDelawareDominicanDutchDutch West IndianEastern EuropeanEcuadorianEgyptianEnglishEstonianEthiopianEuropeanFijianFilipinoFinnishFrench American IndianFrench CanadianGermanGerman RussianGhanaianGreekGuamanian/ChamorroGuatemalanGuyaneseHaitianHmongHonduranHopiHoumaHungarianIcelanderIndian (Asian)IndonesianInupiatIranianIraqiIrishIroquoisIsraeliItalianJamaicanJapaneseJordanianKenyanKiowaKoreanLaotianLatvianLebaneseLiberianLithuanianLumbeeLuxembourgerMacedonianMalaysianMalteseMarshalleseMenomineeMexicanMexican American IndianMongolianMoroccanNative HawaiianNavajoNepaleseNew ZealanderNicaraguanNigerianNorthern EuropeanNorwegianOkinawanOsageOttawaPaiutePakistaniPalestinianPanamanianParaguayanPennsylvania GermanPeruvianPimaPolishPortuguesePotawatomiPuebloPuerto RicanPuget Sound SalishRomanianRussianSalvadoranSamoanScandinavianScotch-IrishScottishSeminoleSenegaleseSerbianShoshoneSierra LeoneanSiouxSlavicSlovakSloveneSomaliSouth AfricanSouth AmericanSouth American IndianSoviet UnionSpaniardSpanishSpanish AmericanSpanish American IndianSri LankanSubsaharan AfricanSudaneseSwedishSwissSyrianTaiwaneseThaiTlingit-HaidaTohono O'OdhamTonganTrinidadian and TobagonianTsimshianTurkishU.S. Virgin IslanderUgandanUkrainianUruguayanUteVenezuelanVietnameseWelshWest IndianYakamaYaquiYugoslavianYumanYup'ikZimbabwean
Immigration
NonimmigrantsImmigrantsAfghanistanAfricaAlbaniaArgentinaArmeniaAsiaAustraliaAustriaBahamasBangladeshBarbadosBelarusBelgiumBelizeBoliviaBosnia and HerzegovinaBrazilBulgariaBurma/MyanmarCabo VerdeCambodiaCameroonCanadaCaribbeanCentral AmericaChileChinaColombiaCongoCosta RicaCroatiaCubaCzechoslovakiaDenmarkDominicaDominican RepublicEastern AfricaEastern AsiaEastern EuropeEcuadorEgyptEl SalvadorEnglandEritreaEthiopiaEuropeFijiFranceGermanyGhanaGreeceGrenadaGuatemalaGuyanaHaitiHondurasHong KongHungaryIndiaIndonesiaIranIraqIrelandIsraelItalyJamaicaJapanJordanKazakhstanKenyaKoreaKuwaitLaosLatin AmericaLatviaLebanonLiberiaLithuaniaMalaysiaMexicoMicronesiaMiddle AfricaMoldovaMoroccoNepalNetherlandsNicaraguaNigeriaNorth AmericaNorth MacedoniaNorthern AfricaNorthern EuropeNorwayOceaniaPakistanPanamaPeruPhilippinesPolandPortugalRomaniaRussiaSaudi ArabiaScotlandSenegalSerbiaSierra LeoneSingaporeSomaliaSouth AfricaSouth AmericaSouth Central AsiaSouth Eastern AsiaSouthern EuropeSpainSri LankaSt. Vincent and the GrenadinesSudanSwedenSwitzerlandSyriaTaiwanThailandTrinidad and TobagoTurkeyUgandaUkraineUruguayUzbekistanVenezuelaVietnamWest IndiesWestern AfricaWestern AsiaWestern EuropeYemenZaireZimbabweAzores
8th Grade
Income
Poverty
Unemployment
Labor Participation
Family Structure
Vehicle Availability
Education Level
Disability

8th Grade Comparison

French

Burmese

Exceptional
Exceptional
97.1%
8TH GRADE
100.0/ 100
METRIC RATING
26th/ 347
METRIC RANK
96.1%
8TH GRADE
90.2/ 100
METRIC RATING
138th/ 347
METRIC RANK

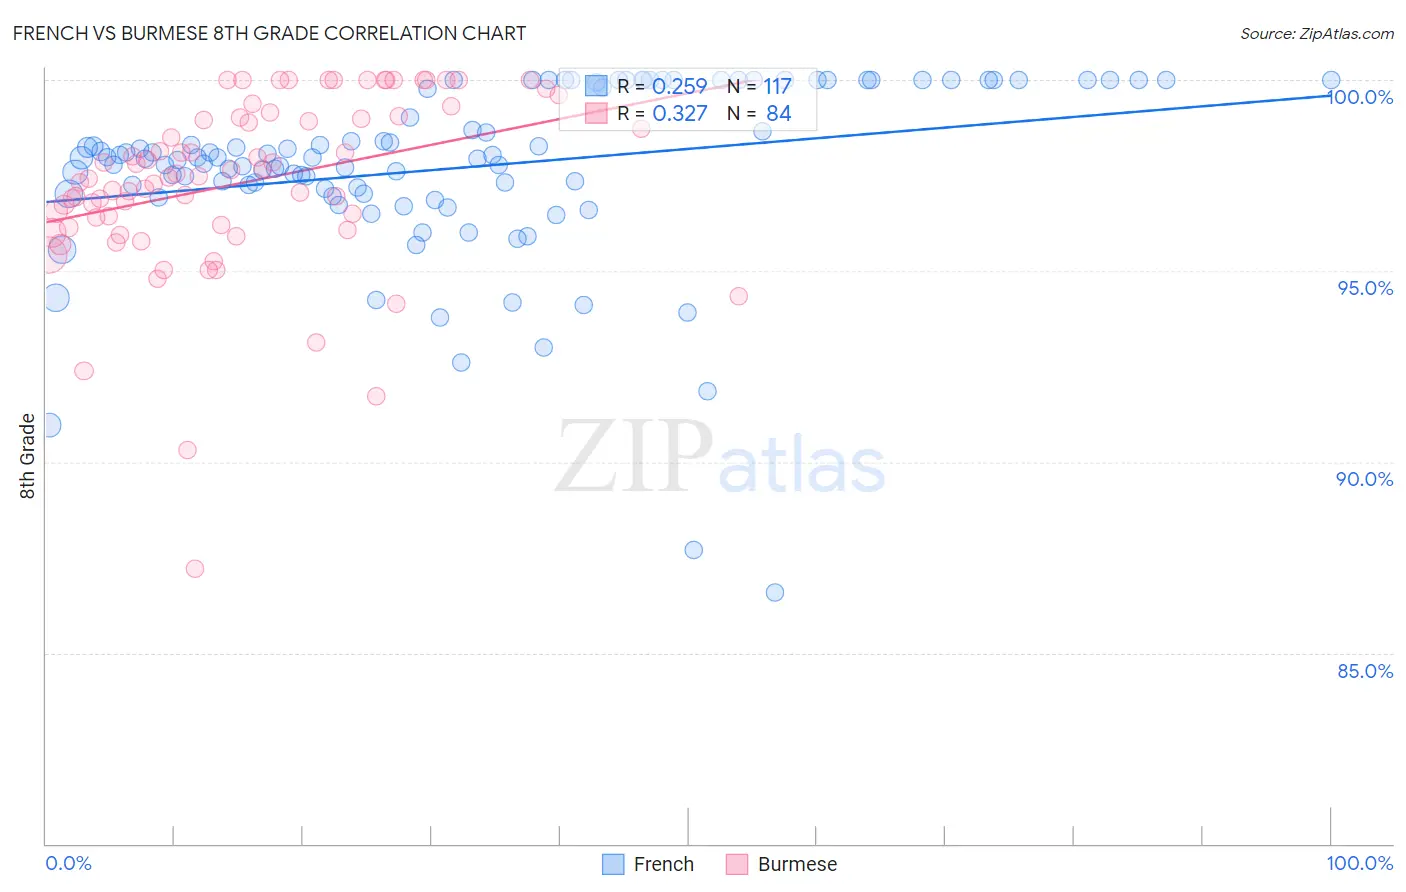
French vs Burmese 8th Grade Correlation Chart

The statistical analysis conducted on geographies consisting of 572,427,255 people shows a weak positive correlation between the proportion of French and percentage of population with at least 8th grade education in the United States with a correlation coefficient (R) of 0.259 and weighted average of 97.1%. Similarly, the statistical analysis conducted on geographies consisting of 465,275,888 people shows a mild positive correlation between the proportion of Burmese and percentage of population with at least 8th grade education in the United States with a correlation coefficient (R) of 0.327 and weighted average of 96.1%, a difference of 1.1%.
French vs Burmese 8th Grade

8th Grade Correlation Summary

MeasurementFrenchBurmese
Minimum86.6%87.2%
Maximum100.0%100.0%
Range13.4%12.8%
Mean97.7%97.3%
Median98.0%97.5%
Interquartile 25% (IQ1)97.1%96.2%
Interquartile 75% (IQ3)100.0%99.0%
Interquartile Range (IQR)2.9%2.8%
Standard Deviation (Sample)2.4%2.3%
Standard Deviation (Population)2.3%2.3%

Similar Demographics by 8th Grade

Demographics Similar to French by 8th Grade

In terms of 8th grade, the demographic groups most similar to French are Czech (97.1%, a difference of 0.0%), Scandinavian (97.2%, a difference of 0.010%), French Canadian (97.2%, a difference of 0.020%), Scotch-Irish (97.1%, a difference of 0.020%), and Welsh (97.2%, a difference of 0.030%).
DemographicsRating | Rank8th Grade
Scottish
100.0
/100
|
#19
Exceptional
97.3%
Croatians
100.0
/100
|
#20
Exceptional
97.2%
Danes
100.0
/100
|
#21
Exceptional
97.2%
Welsh
100.0
/100
|
#22
Exceptional
97.2%
French Canadians
100.0
/100
|
#23
Exceptional
97.2%
Scandinavians
100.0
/100
|
#24
Exceptional
97.2%
Czechs
100.0
/100
|
#25
Exceptional
97.1%
French
100.0
/100
|
#26
Exceptional
97.1%
Scotch-Irish
100.0
/100
|
#27
Exceptional
97.1%
Italians
100.0
/100
|
#28
Exceptional
97.1%
Europeans
100.0
/100
|
#29
Exceptional
97.1%
Sioux
100.0
/100
|
#30
Exceptional
97.1%
Chippewa
100.0
/100
|
#31
Exceptional
97.1%
Yup'ik
100.0
/100
|
#32
Exceptional
97.0%
Swiss
100.0
/100
|
#33
Exceptional
97.0%

Demographics Similar to Burmese by 8th Grade

In terms of 8th grade, the demographic groups most similar to Burmese are Cambodian (96.1%, a difference of 0.010%), Hmong (96.1%, a difference of 0.010%), Immigrants from South Central Asia (96.1%, a difference of 0.010%), Basque (96.1%, a difference of 0.020%), and Jordanian (96.1%, a difference of 0.020%).
DemographicsRating | Rank8th Grade
Pueblo
92.3
/100
|
#131
Exceptional
96.1%
Immigrants | Kuwait
92.2
/100
|
#132
Exceptional
96.1%
Immigrants | Turkey
91.7
/100
|
#133
Exceptional
96.1%
Immigrants | Hungary
91.5
/100
|
#134
Exceptional
96.1%
Basques
91.5
/100
|
#135
Exceptional
96.1%
Jordanians
91.3
/100
|
#136
Exceptional
96.1%
Cambodians
90.6
/100
|
#137
Exceptional
96.1%
Burmese
90.2
/100
|
#138
Exceptional
96.1%
Hmong
89.7
/100
|
#139
Excellent
96.1%
Immigrants | South Central Asia
89.4
/100
|
#140
Excellent
96.1%
Immigrants | Greece
85.9
/100
|
#141
Excellent
96.0%
Immigrants | Eastern Europe
85.4
/100
|
#142
Excellent
96.0%
Spanish
85.1
/100
|
#143
Excellent
96.0%
Immigrants | Belarus
84.8
/100
|
#144
Excellent
96.0%
Lumbee
84.1
/100
|
#145
Excellent
96.0%