French vs Bahamian Doctorate Degree
COMPARE
French
Bahamian
Doctorate Degree
Doctorate Degree Comparison
French
Bahamians
1.8%
DOCTORATE DEGREE
48.8/ 100
METRIC RATING
178th/ 347
METRIC RANK
1.5%
DOCTORATE DEGREE
0.4/ 100
METRIC RATING
277th/ 347
METRIC RANK
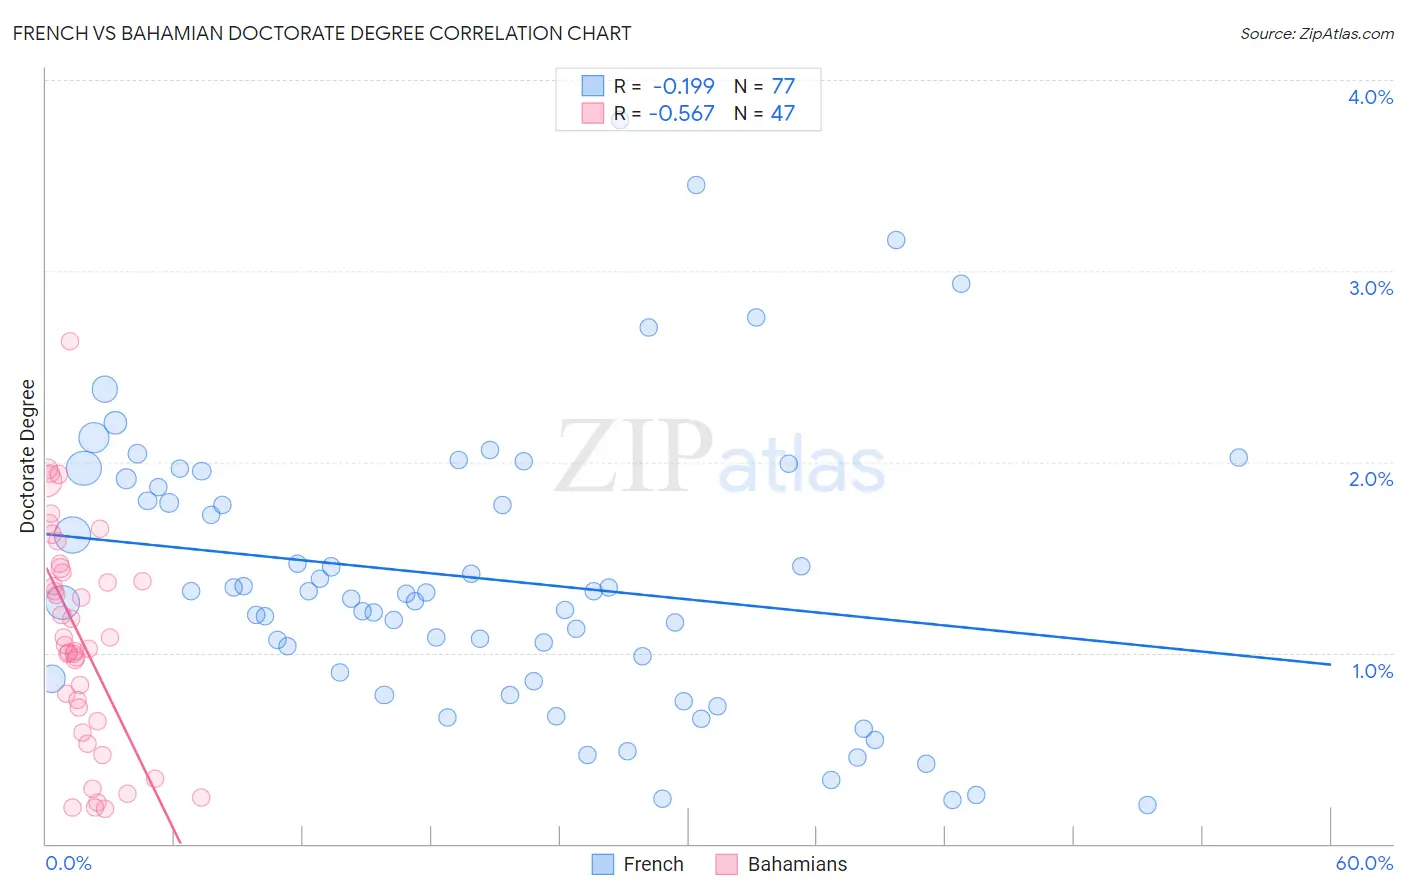
French vs Bahamian Doctorate Degree Correlation Chart
The statistical analysis conducted on geographies consisting of 547,467,794 people shows a poor negative correlation between the proportion of French and percentage of population with at least doctorate degree education in the United States with a correlation coefficient (R) of -0.199 and weighted average of 1.8%. Similarly, the statistical analysis conducted on geographies consisting of 112,287,589 people shows a substantial negative correlation between the proportion of Bahamians and percentage of population with at least doctorate degree education in the United States with a correlation coefficient (R) of -0.567 and weighted average of 1.5%, a difference of 25.5%.
Doctorate Degree Correlation Summary
| Measurement | French | Bahamian |
| Minimum | 0.20% | 0.18% |
| Maximum | 3.8% | 2.6% |
| Range | 3.6% | 2.5% |
| Mean | 1.4% | 1.1% |
| Median | 1.3% | 1.0% |
| Interquartile 25% (IQ1) | 0.86% | 0.64% |
| Interquartile 75% (IQ3) | 1.9% | 1.4% |
| Interquartile Range (IQR) | 1.0% | 0.80% |
| Standard Deviation (Sample) | 0.75% | 0.57% |
| Standard Deviation (Population) | 0.74% | 0.57% |
Similar Demographics by Doctorate Degree
Demographics Similar to French by Doctorate Degree
In terms of doctorate degree, the demographic groups most similar to French are Iraqi (1.8%, a difference of 0.060%), Spanish (1.8%, a difference of 0.070%), Ghanaian (1.8%, a difference of 0.070%), Immigrants from Thailand (1.8%, a difference of 0.090%), and Scandinavian (1.8%, a difference of 0.12%).
| Demographics | Rating | Rank | Doctorate Degree |
| Bermudans | 52.1 /100 | #171 | Average 1.8% |
| Belgians | 50.3 /100 | #172 | Average 1.8% |
| Norwegians | 50.0 /100 | #173 | Average 1.8% |
| Immigrants | Bangladesh | 50.0 /100 | #174 | Average 1.8% |
| Immigrants | Thailand | 49.4 /100 | #175 | Average 1.8% |
| Spanish | 49.3 /100 | #176 | Average 1.8% |
| Iraqis | 49.2 /100 | #177 | Average 1.8% |
| French | 48.8 /100 | #178 | Average 1.8% |
| Ghanaians | 48.3 /100 | #179 | Average 1.8% |
| Scandinavians | 48.0 /100 | #180 | Average 1.8% |
| Immigrants | Immigrants | 46.2 /100 | #181 | Average 1.8% |
| Immigrants | Afghanistan | 44.3 /100 | #182 | Average 1.8% |
| Finns | 42.1 /100 | #183 | Average 1.8% |
| Nigerians | 39.9 /100 | #184 | Fair 1.8% |
| Slovaks | 36.4 /100 | #185 | Fair 1.8% |
Demographics Similar to Bahamians by Doctorate Degree
In terms of doctorate degree, the demographic groups most similar to Bahamians are Hawaiian (1.5%, a difference of 0.060%), Marshallese (1.5%, a difference of 0.28%), Ecuadorian (1.5%, a difference of 0.29%), Tohono O'odham (1.5%, a difference of 0.35%), and British West Indian (1.5%, a difference of 0.41%).
| Demographics | Rating | Rank | Doctorate Degree |
| Salvadorans | 0.5 /100 | #270 | Tragic 1.5% |
| Immigrants | Trinidad and Tobago | 0.5 /100 | #271 | Tragic 1.5% |
| Immigrants | Barbados | 0.4 /100 | #272 | Tragic 1.5% |
| Sioux | 0.4 /100 | #273 | Tragic 1.5% |
| Yaqui | 0.4 /100 | #274 | Tragic 1.5% |
| Aleuts | 0.4 /100 | #275 | Tragic 1.5% |
| Paiute | 0.4 /100 | #276 | Tragic 1.5% |
| Bahamians | 0.4 /100 | #277 | Tragic 1.5% |
| Hawaiians | 0.4 /100 | #278 | Tragic 1.5% |
| Marshallese | 0.4 /100 | #279 | Tragic 1.5% |
| Ecuadorians | 0.4 /100 | #280 | Tragic 1.5% |
| Tohono O'odham | 0.4 /100 | #281 | Tragic 1.5% |
| British West Indians | 0.3 /100 | #282 | Tragic 1.5% |
| Central Americans | 0.3 /100 | #283 | Tragic 1.5% |
| Jamaicans | 0.3 /100 | #284 | Tragic 1.5% |