French Canadian vs Immigrants from Yemen High School Diploma

COMPARE

French Canadian
Race
Ancestry
AfghanAfricanAlaska NativeAlaskan AthabascanAlbanianAleutAlsatianAmericanApacheArabArapahoArgentineanArmenianAssyrian/Chaldean/SyriacAustralianAustrianBahamianBangladeshiBarbadianBasqueBelgianBelizeanBermudanBhutaneseBlackfeetBolivianBrazilianBritishBritish West IndianBulgarianBurmeseCajunCambodianCanadianCape VerdeanCarpatho RusynCelticCentral AmericanCentral American IndianCherokeeCheyenneChickasawChileanChineseChippewaChoctawColombianColvilleComancheCosta RicanCreeCreekCroatianCrowCubanCypriotCzechCzechoslovakianDanishDelawareDominicanDutchDutch West IndianEastern EuropeanEcuadorianEgyptianEnglishEstonianEthiopianEuropeanFijianFilipinoFinnishFrenchFrench American IndianFrench CanadianGermanGerman RussianGhanaianGreekGuamanian/ChamorroGuatemalanGuyaneseHaitianHmongHonduranHopiHoumaHungarianIcelanderIndian (Asian)IndonesianInupiatIranianIraqiIrishIroquoisIsraeliItalianJamaicanJapaneseJordanianKenyanKiowaKoreanLaotianLatvianLebaneseLiberianLithuanianLumbeeLuxembourgerMacedonianMalaysianMalteseMarshalleseMenomineeMexicanMexican American IndianMongolianMoroccanNative HawaiianNavajoNepaleseNew ZealanderNicaraguanNigerianNorthern EuropeanNorwegianOkinawanOsageOttawaPaiutePakistaniPalestinianPanamanianParaguayanPennsylvania GermanPeruvianPimaPolishPortuguesePotawatomiPuebloPuerto RicanPuget Sound SalishRomanianRussianSalvadoranSamoanScandinavianScotch-IrishScottishSeminoleSenegaleseSerbianShoshoneSierra LeoneanSiouxSlavicSlovakSloveneSomaliSouth AfricanSouth AmericanSouth American IndianSoviet UnionSpaniardSpanishSpanish AmericanSpanish American IndianSri LankanSubsaharan AfricanSudaneseSwedishSwissSyrianTaiwaneseThaiTlingit-HaidaTohono O'OdhamTonganTrinidadian and TobagonianTsimshianTurkishU.S. Virgin IslanderUgandanUkrainianUruguayanUteVenezuelanVietnameseWelshWest IndianYakamaYaquiYugoslavianYumanYup'ikZimbabwean
Immigration
NonimmigrantsImmigrantsAfghanistanAfricaAlbaniaArgentinaArmeniaAsiaAustraliaAustriaBahamasBangladeshBarbadosBelarusBelgiumBelizeBoliviaBosnia and HerzegovinaBrazilBulgariaBurma/MyanmarCabo VerdeCambodiaCameroonCanadaCaribbeanCentral AmericaChileChinaColombiaCongoCosta RicaCroatiaCubaCzechoslovakiaDenmarkDominicaDominican RepublicEastern AfricaEastern AsiaEastern EuropeEcuadorEgyptEl SalvadorEnglandEritreaEthiopiaEuropeFijiFranceGermanyGhanaGreeceGrenadaGuatemalaGuyanaHaitiHondurasHong KongHungaryIndiaIndonesiaIranIraqIrelandIsraelItalyJamaicaJapanJordanKazakhstanKenyaKoreaKuwaitLaosLatin AmericaLatviaLebanonLiberiaLithuaniaMalaysiaMexicoMicronesiaMiddle AfricaMoldovaMoroccoNepalNetherlandsNicaraguaNigeriaNorth AmericaNorth MacedoniaNorthern AfricaNorthern EuropeNorwayOceaniaPakistanPanamaPeruPhilippinesPolandPortugalRomaniaRussiaSaudi ArabiaScotlandSenegalSerbiaSierra LeoneSingaporeSomaliaSouth AfricaSouth AmericaSouth Central AsiaSouth Eastern AsiaSouthern EuropeSpainSri LankaSt. Vincent and the GrenadinesSudanSwedenSwitzerlandSyriaTaiwanThailandTrinidad and TobagoTurkeyUgandaUkraineUruguayUzbekistanVenezuelaVietnamWest IndiesWestern AfricaWestern AsiaWestern EuropeZaireZimbabweAzores
Immigrants from Yemen
Race
Ancestry
AfghanAfricanAlaska NativeAlaskan AthabascanAlbanianAleutAlsatianAmericanApacheArabArapahoArgentineanArmenianAssyrian/Chaldean/SyriacAustralianAustrianBahamianBangladeshiBarbadianBasqueBelgianBelizeanBermudanBhutaneseBlackfeetBolivianBrazilianBritishBritish West IndianBulgarianBurmeseCajunCambodianCanadianCape VerdeanCarpatho RusynCelticCentral AmericanCentral American IndianCherokeeCheyenneChickasawChileanChineseChippewaChoctawColombianColvilleComancheCosta RicanCreeCreekCroatianCrowCubanCypriotCzechCzechoslovakianDanishDelawareDominicanDutchDutch West IndianEastern EuropeanEcuadorianEgyptianEnglishEstonianEthiopianEuropeanFijianFilipinoFinnishFrenchFrench American IndianGermanGerman RussianGhanaianGreekGuamanian/ChamorroGuatemalanGuyaneseHaitianHmongHonduranHopiHoumaHungarianIcelanderIndian (Asian)IndonesianInupiatIranianIraqiIrishIroquoisIsraeliItalianJamaicanJapaneseJordanianKenyanKiowaKoreanLaotianLatvianLebaneseLiberianLithuanianLumbeeLuxembourgerMacedonianMalaysianMalteseMarshalleseMenomineeMexicanMexican American IndianMongolianMoroccanNative HawaiianNavajoNepaleseNew ZealanderNicaraguanNigerianNorthern EuropeanNorwegianOkinawanOsageOttawaPaiutePakistaniPalestinianPanamanianParaguayanPennsylvania GermanPeruvianPimaPolishPortuguesePotawatomiPuebloPuerto RicanPuget Sound SalishRomanianRussianSalvadoranSamoanScandinavianScotch-IrishScottishSeminoleSenegaleseSerbianShoshoneSierra LeoneanSiouxSlavicSlovakSloveneSomaliSouth AfricanSouth AmericanSouth American IndianSoviet UnionSpaniardSpanishSpanish AmericanSpanish American IndianSri LankanSubsaharan AfricanSudaneseSwedishSwissSyrianTaiwaneseThaiTlingit-HaidaTohono O'OdhamTonganTrinidadian and TobagonianTsimshianTurkishU.S. Virgin IslanderUgandanUkrainianUruguayanUteVenezuelanVietnameseWelshWest IndianYakamaYaquiYugoslavianYumanYup'ikZimbabwean
Immigration
NonimmigrantsImmigrantsAfghanistanAfricaAlbaniaArgentinaArmeniaAsiaAustraliaAustriaBahamasBangladeshBarbadosBelarusBelgiumBelizeBoliviaBosnia and HerzegovinaBrazilBulgariaBurma/MyanmarCabo VerdeCambodiaCameroonCanadaCaribbeanCentral AmericaChileChinaColombiaCongoCosta RicaCroatiaCubaCzechoslovakiaDenmarkDominicaDominican RepublicEastern AfricaEastern AsiaEastern EuropeEcuadorEgyptEl SalvadorEnglandEritreaEthiopiaEuropeFijiFranceGermanyGhanaGreeceGrenadaGuatemalaGuyanaHaitiHondurasHong KongHungaryIndiaIndonesiaIranIraqIrelandIsraelItalyJamaicaJapanJordanKazakhstanKenyaKoreaKuwaitLaosLatin AmericaLatviaLebanonLiberiaLithuaniaMalaysiaMexicoMicronesiaMiddle AfricaMoldovaMoroccoNepalNetherlandsNicaraguaNigeriaNorth AmericaNorth MacedoniaNorthern AfricaNorthern EuropeNorwayOceaniaPakistanPanamaPeruPhilippinesPolandPortugalRomaniaRussiaSaudi ArabiaScotlandSenegalSerbiaSierra LeoneSingaporeSomaliaSouth AfricaSouth AmericaSouth Central AsiaSouth Eastern AsiaSouthern EuropeSpainSri LankaSt. Vincent and the GrenadinesSudanSwedenSwitzerlandSyriaTaiwanThailandTrinidad and TobagoTurkeyUgandaUkraineUruguayUzbekistanVenezuelaVietnamWest IndiesWestern AfricaWestern AsiaWestern EuropeYemenZaireZimbabweAzores
High School Diploma
Income
Poverty
Unemployment
Labor Participation
Family Structure
Vehicle Availability
Education Level
Disability

High School Diploma Comparison

French Canadians

Immigrants from Yemen

Exceptional
Tragic
90.9%
HIGH SCHOOL DIPLOMA
99.5/ 100
METRIC RATING
69th/ 347
METRIC RANK
81.8%
HIGH SCHOOL DIPLOMA
0.0/ 100
METRIC RATING
337th/ 347
METRIC RANK

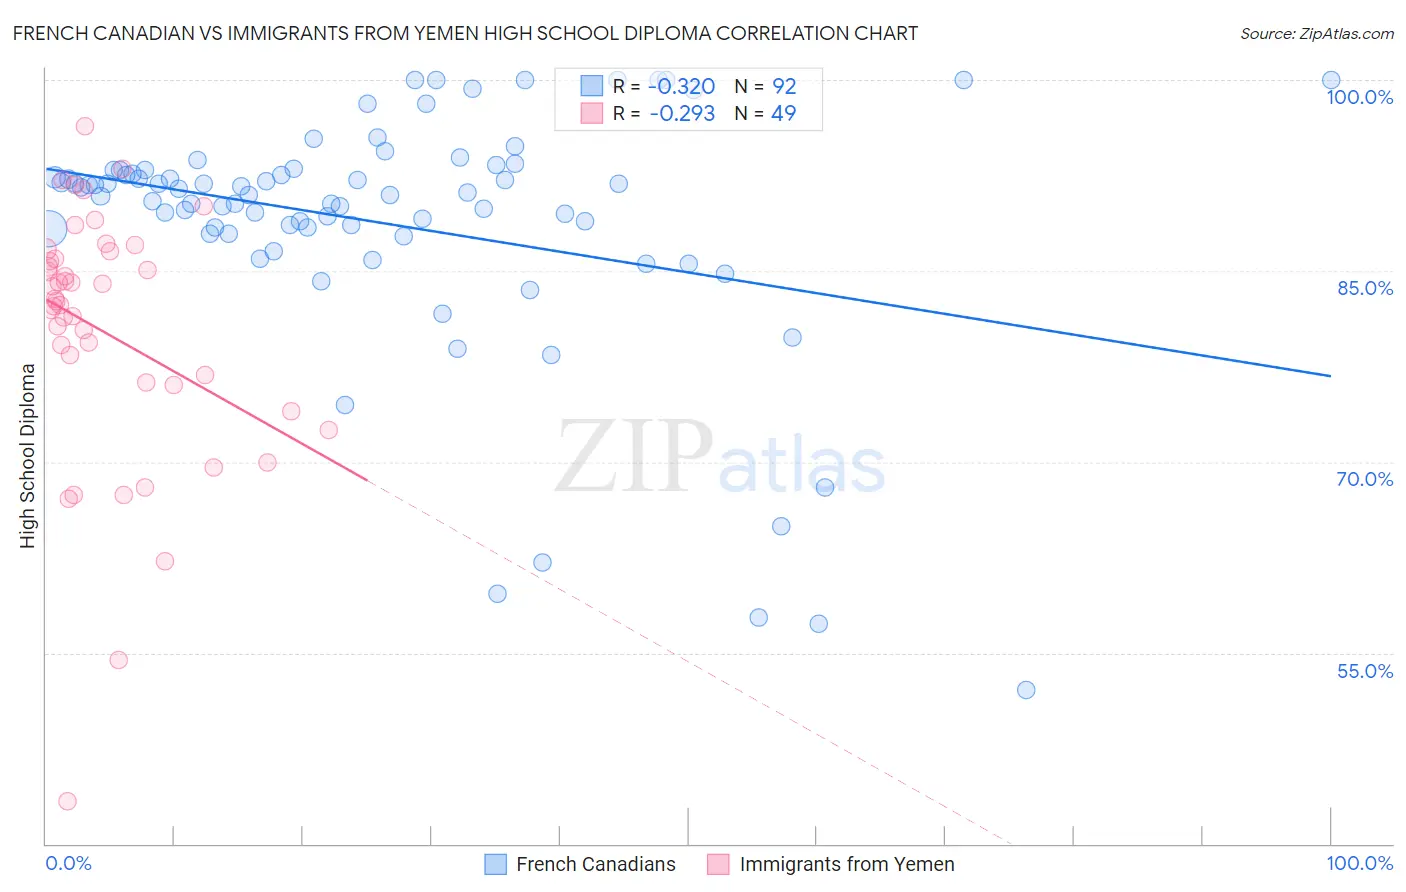
French Canadian vs Immigrants from Yemen High School Diploma Correlation Chart

The statistical analysis conducted on geographies consisting of 502,680,196 people shows a mild negative correlation between the proportion of French Canadians and percentage of population with at least high school diploma education in the United States with a correlation coefficient (R) of -0.320 and weighted average of 90.9%. Similarly, the statistical analysis conducted on geographies consisting of 82,429,885 people shows a weak negative correlation between the proportion of Immigrants from Yemen and percentage of population with at least high school diploma education in the United States with a correlation coefficient (R) of -0.293 and weighted average of 81.8%, a difference of 11.1%.
French Canadian vs Immigrants from Yemen High School Diploma

High School Diploma Correlation Summary

MeasurementFrench CanadianImmigrants from Yemen
Minimum52.1%43.3%
Maximum100.0%96.4%
Range47.9%53.1%
Mean88.8%80.2%
Median91.1%82.6%
Interquartile 25% (IQ1)88.2%76.1%
Interquartile 75% (IQ3)92.9%86.2%
Interquartile Range (IQR)4.8%10.1%
Standard Deviation (Sample)9.7%10.1%
Standard Deviation (Population)9.6%10.0%

Similar Demographics by High School Diploma

Demographics Similar to French Canadians by High School Diploma

In terms of high school diploma, the demographic groups most similar to French Canadians are Immigrants from Latvia (90.9%, a difference of 0.0%), Alaskan Athabascan (90.9%, a difference of 0.010%), Soviet Union (90.9%, a difference of 0.010%), Czechoslovakian (90.9%, a difference of 0.030%), and Immigrants from Iran (90.9%, a difference of 0.040%).
DemographicsRating | RankHigh School Diploma
Austrians
99.6
/100
|
#62
Exceptional
91.0%
Immigrants | Netherlands
99.6
/100
|
#63
Exceptional
91.0%
Ukrainians
99.6
/100
|
#64
Exceptional
91.0%
Immigrants | South Africa
99.6
/100
|
#65
Exceptional
91.0%
French
99.5
/100
|
#66
Exceptional
91.0%
Immigrants | Iran
99.5
/100
|
#67
Exceptional
90.9%
Czechoslovakians
99.5
/100
|
#68
Exceptional
90.9%
French Canadians
99.5
/100
|
#69
Exceptional
90.9%
Immigrants | Latvia
99.5
/100
|
#70
Exceptional
90.9%
Alaskan Athabascans
99.4
/100
|
#71
Exceptional
90.9%
Soviet Union
99.4
/100
|
#72
Exceptional
90.9%
Immigrants | South Central Asia
99.4
/100
|
#73
Exceptional
90.9%
Immigrants | Czechoslovakia
99.4
/100
|
#74
Exceptional
90.9%
Cambodians
99.4
/100
|
#75
Exceptional
90.8%
Hungarians
99.3
/100
|
#76
Exceptional
90.8%

Demographics Similar to Immigrants from Yemen by High School Diploma

In terms of high school diploma, the demographic groups most similar to Immigrants from Yemen are Guatemalan (82.0%, a difference of 0.15%), Immigrants from Dominican Republic (82.0%, a difference of 0.15%), Salvadoran (81.7%, a difference of 0.17%), Tohono O'odham (82.1%, a difference of 0.27%), and Pima (81.6%, a difference of 0.27%).
DemographicsRating | RankHigh School Diploma
Immigrants | Azores
0.0
/100
|
#330
Tragic
82.8%
Central Americans
0.0
/100
|
#331
Tragic
82.5%
Immigrants | Honduras
0.0
/100
|
#332
Tragic
82.5%
Immigrants | Latin America
0.0
/100
|
#333
Tragic
82.1%
Tohono O'odham
0.0
/100
|
#334
Tragic
82.1%
Guatemalans
0.0
/100
|
#335
Tragic
82.0%
Immigrants | Dominican Republic
0.0
/100
|
#336
Tragic
82.0%
Immigrants | Yemen
0.0
/100
|
#337
Tragic
81.8%
Salvadorans
0.0
/100
|
#338
Tragic
81.7%
Pima
0.0
/100
|
#339
Tragic
81.6%
Houma
0.0
/100
|
#340
Tragic
81.5%
Mexicans
0.0
/100
|
#341
Tragic
81.4%
Immigrants | Guatemala
0.0
/100
|
#342
Tragic
81.4%
Immigrants | El Salvador
0.0
/100
|
#343
Tragic
80.8%
Immigrants | Central America
0.0
/100
|
#344
Tragic
80.1%