French Canadian vs Immigrants from Bolivia 6th Grade

COMPARE

French Canadian
Race
Ancestry
AfghanAfricanAlaska NativeAlaskan AthabascanAlbanianAleutAlsatianAmericanApacheArabArapahoArgentineanArmenianAssyrian/Chaldean/SyriacAustralianAustrianBahamianBangladeshiBarbadianBasqueBelgianBelizeanBermudanBhutaneseBlackfeetBolivianBrazilianBritishBritish West IndianBulgarianBurmeseCajunCambodianCanadianCape VerdeanCarpatho RusynCelticCentral AmericanCentral American IndianCherokeeCheyenneChickasawChileanChineseChippewaChoctawColombianColvilleComancheCosta RicanCreeCreekCroatianCrowCubanCypriotCzechCzechoslovakianDanishDelawareDominicanDutchDutch West IndianEastern EuropeanEcuadorianEgyptianEnglishEstonianEthiopianEuropeanFijianFilipinoFinnishFrenchFrench American IndianFrench CanadianGermanGerman RussianGhanaianGreekGuamanian/ChamorroGuatemalanGuyaneseHaitianHmongHonduranHopiHoumaHungarianIcelanderIndian (Asian)IndonesianInupiatIranianIraqiIrishIroquoisIsraeliItalianJamaicanJapaneseJordanianKenyanKiowaKoreanLaotianLatvianLebaneseLiberianLithuanianLumbeeLuxembourgerMacedonianMalaysianMalteseMarshalleseMenomineeMexicanMexican American IndianMongolianMoroccanNative HawaiianNavajoNepaleseNew ZealanderNicaraguanNigerianNorthern EuropeanNorwegianOkinawanOsageOttawaPaiutePakistaniPalestinianPanamanianParaguayanPennsylvania GermanPeruvianPimaPolishPortuguesePotawatomiPuebloPuerto RicanPuget Sound SalishRomanianRussianSalvadoranSamoanScandinavianScotch-IrishScottishSeminoleSenegaleseSerbianShoshoneSierra LeoneanSiouxSlavicSlovakSloveneSomaliSouth AfricanSouth AmericanSouth American IndianSoviet UnionSpaniardSpanishSpanish AmericanSpanish American IndianSri LankanSubsaharan AfricanSudaneseSwedishSwissSyrianTaiwaneseThaiTlingit-HaidaTohono O'OdhamTonganTrinidadian and TobagonianTsimshianTurkishU.S. Virgin IslanderUgandanUkrainianUruguayanUteVenezuelanVietnameseWelshWest IndianYakamaYaquiYugoslavianYumanYup'ikZimbabwean
Immigration
NonimmigrantsImmigrantsAfghanistanAfricaAlbaniaArgentinaArmeniaAsiaAustraliaAustriaBahamasBangladeshBarbadosBelarusBelgiumBelizeBosnia and HerzegovinaBrazilBulgariaBurma/MyanmarCabo VerdeCambodiaCameroonCanadaCaribbeanCentral AmericaChileChinaColombiaCongoCosta RicaCroatiaCubaCzechoslovakiaDenmarkDominicaDominican RepublicEastern AfricaEastern AsiaEastern EuropeEcuadorEgyptEl SalvadorEnglandEritreaEthiopiaEuropeFijiFranceGermanyGhanaGreeceGrenadaGuatemalaGuyanaHaitiHondurasHong KongHungaryIndiaIndonesiaIranIraqIrelandIsraelItalyJamaicaJapanJordanKazakhstanKenyaKoreaKuwaitLaosLatin AmericaLatviaLebanonLiberiaLithuaniaMalaysiaMexicoMicronesiaMiddle AfricaMoldovaMoroccoNepalNetherlandsNicaraguaNigeriaNorth AmericaNorth MacedoniaNorthern AfricaNorthern EuropeNorwayOceaniaPakistanPanamaPeruPhilippinesPolandPortugalRomaniaRussiaSaudi ArabiaScotlandSenegalSerbiaSierra LeoneSingaporeSomaliaSouth AfricaSouth AmericaSouth Central AsiaSouth Eastern AsiaSouthern EuropeSpainSri LankaSt. Vincent and the GrenadinesSudanSwedenSwitzerlandSyriaTaiwanThailandTrinidad and TobagoTurkeyUgandaUkraineUruguayUzbekistanVenezuelaVietnamWest IndiesWestern AfricaWestern AsiaWestern EuropeYemenZaireZimbabweAzores
Immigrants from Bolivia
Race
Ancestry
AfghanAfricanAlaska NativeAlaskan AthabascanAlbanianAleutAlsatianAmericanApacheArabArapahoArgentineanArmenianAssyrian/Chaldean/SyriacAustralianAustrianBahamianBangladeshiBarbadianBasqueBelgianBelizeanBermudanBhutaneseBlackfeetBolivianBrazilianBritishBritish West IndianBulgarianBurmeseCajunCambodianCanadianCape VerdeanCarpatho RusynCelticCentral AmericanCentral American IndianCherokeeCheyenneChickasawChileanChineseChippewaChoctawColombianColvilleComancheCosta RicanCreeCreekCroatianCrowCubanCypriotCzechCzechoslovakianDanishDelawareDominicanDutchDutch West IndianEastern EuropeanEcuadorianEgyptianEnglishEstonianEthiopianEuropeanFijianFilipinoFinnishFrenchFrench American IndianGermanGerman RussianGhanaianGreekGuamanian/ChamorroGuatemalanGuyaneseHaitianHmongHonduranHopiHoumaHungarianIcelanderIndian (Asian)IndonesianInupiatIranianIraqiIrishIroquoisIsraeliItalianJamaicanJapaneseJordanianKenyanKiowaKoreanLaotianLatvianLebaneseLiberianLithuanianLumbeeLuxembourgerMacedonianMalaysianMalteseMarshalleseMenomineeMexicanMexican American IndianMongolianMoroccanNative HawaiianNavajoNepaleseNew ZealanderNicaraguanNigerianNorthern EuropeanNorwegianOkinawanOsageOttawaPaiutePakistaniPalestinianPanamanianParaguayanPennsylvania GermanPeruvianPimaPolishPortuguesePotawatomiPuebloPuerto RicanPuget Sound SalishRomanianRussianSalvadoranSamoanScandinavianScotch-IrishScottishSeminoleSenegaleseSerbianShoshoneSierra LeoneanSiouxSlavicSlovakSloveneSomaliSouth AfricanSouth AmericanSouth American IndianSoviet UnionSpaniardSpanishSpanish AmericanSpanish American IndianSri LankanSubsaharan AfricanSudaneseSwedishSwissSyrianTaiwaneseThaiTlingit-HaidaTohono O'OdhamTonganTrinidadian and TobagonianTsimshianTurkishU.S. Virgin IslanderUgandanUkrainianUruguayanUteVenezuelanVietnameseWelshWest IndianYakamaYaquiYugoslavianYumanYup'ikZimbabwean
Immigration
NonimmigrantsImmigrantsAfghanistanAfricaAlbaniaArgentinaArmeniaAsiaAustraliaAustriaBahamasBangladeshBarbadosBelarusBelgiumBelizeBoliviaBosnia and HerzegovinaBrazilBulgariaBurma/MyanmarCabo VerdeCambodiaCameroonCanadaCaribbeanCentral AmericaChileChinaColombiaCongoCosta RicaCroatiaCubaCzechoslovakiaDenmarkDominicaDominican RepublicEastern AfricaEastern AsiaEastern EuropeEcuadorEgyptEl SalvadorEnglandEritreaEthiopiaEuropeFijiFranceGermanyGhanaGreeceGrenadaGuatemalaGuyanaHaitiHondurasHong KongHungaryIndiaIndonesiaIranIraqIrelandIsraelItalyJamaicaJapanJordanKazakhstanKenyaKoreaKuwaitLaosLatin AmericaLatviaLebanonLiberiaLithuaniaMalaysiaMexicoMicronesiaMiddle AfricaMoldovaMoroccoNepalNetherlandsNicaraguaNigeriaNorth AmericaNorth MacedoniaNorthern AfricaNorthern EuropeNorwayOceaniaPakistanPanamaPeruPhilippinesPolandPortugalRomaniaRussiaSaudi ArabiaScotlandSenegalSerbiaSierra LeoneSingaporeSomaliaSouth AfricaSouth AmericaSouth Central AsiaSouth Eastern AsiaSouthern EuropeSpainSri LankaSt. Vincent and the GrenadinesSudanSwedenSwitzerlandSyriaTaiwanThailandTrinidad and TobagoTurkeyUgandaUkraineUruguayUzbekistanVenezuelaVietnamWest IndiesWestern AfricaWestern AsiaWestern EuropeYemenZaireZimbabweAzores
6th Grade
Income
Poverty
Unemployment
Labor Participation
Family Structure
Vehicle Availability
Education Level
Disability

6th Grade Comparison

French Canadians

Immigrants from Bolivia

Exceptional
Tragic
98.0%
6TH GRADE
100.0/ 100
METRIC RATING
30th/ 347
METRIC RANK
96.3%
6TH GRADE
0.1/ 100
METRIC RATING
272nd/ 347
METRIC RANK

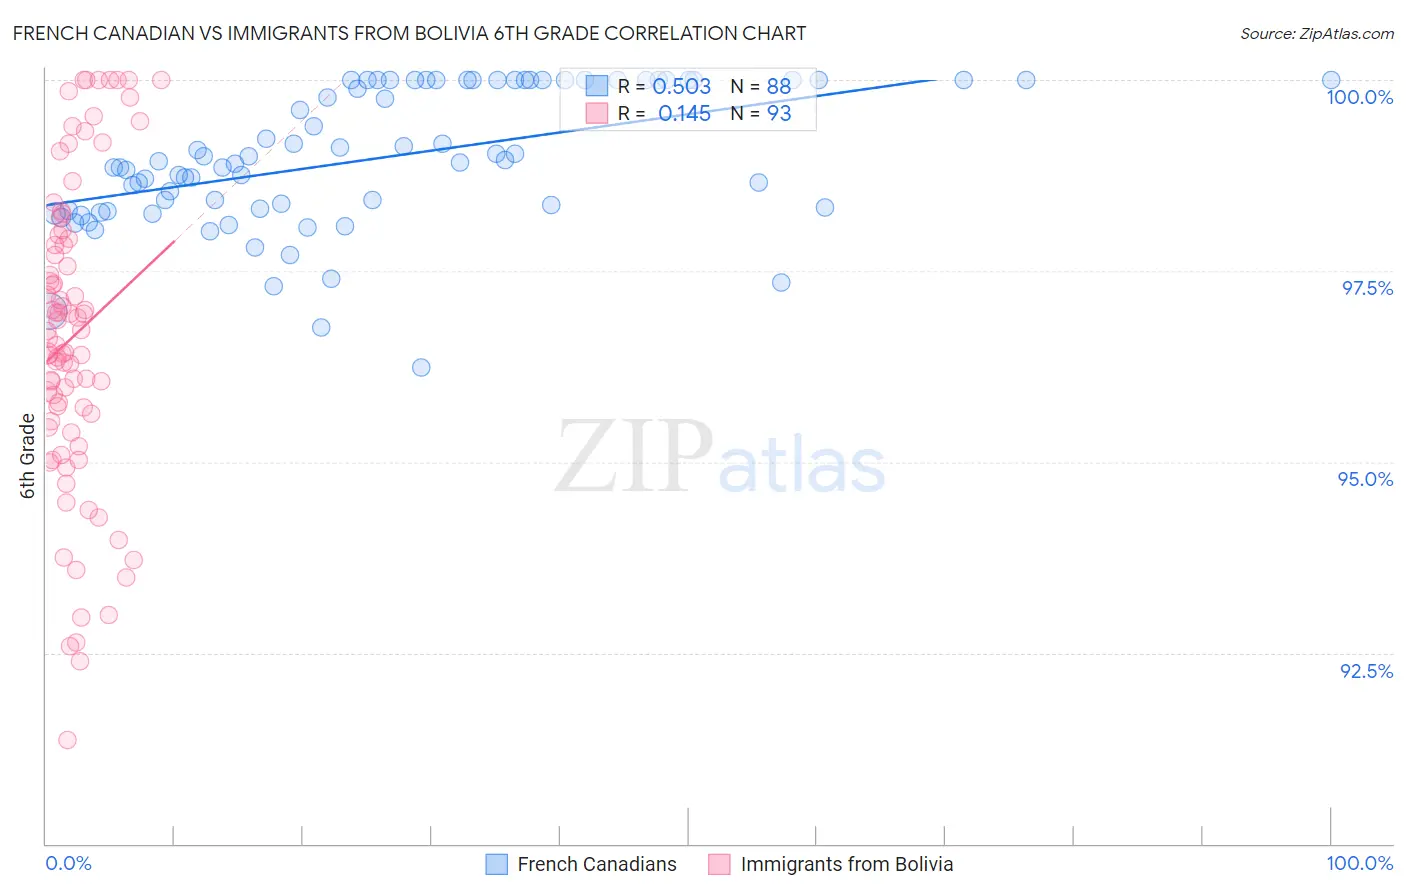
French Canadian vs Immigrants from Bolivia 6th Grade Correlation Chart

The statistical analysis conducted on geographies consisting of 502,679,457 people shows a substantial positive correlation between the proportion of French Canadians and percentage of population with at least 6th grade education in the United States with a correlation coefficient (R) of 0.503 and weighted average of 98.0%. Similarly, the statistical analysis conducted on geographies consisting of 158,718,022 people shows a poor positive correlation between the proportion of Immigrants from Bolivia and percentage of population with at least 6th grade education in the United States with a correlation coefficient (R) of 0.145 and weighted average of 96.3%, a difference of 1.8%.
French Canadian vs Immigrants from Bolivia 6th Grade

6th Grade Correlation Summary

MeasurementFrench CanadianImmigrants from Bolivia
Minimum96.2%91.4%
Maximum100.0%100.0%
Range3.8%8.6%
Mean99.0%96.6%
Median98.9%96.6%
Interquartile 25% (IQ1)98.3%95.5%
Interquartile 75% (IQ3)100.0%97.9%
Interquartile Range (IQR)1.7%2.5%
Standard Deviation (Sample)0.90%2.0%
Standard Deviation (Population)0.90%2.0%

Similar Demographics by 6th Grade

Demographics Similar to French Canadians by 6th Grade

In terms of 6th grade, the demographic groups most similar to French Canadians are European (98.0%, a difference of 0.0%), Yup'ik (98.0%, a difference of 0.010%), Scandinavian (98.0%, a difference of 0.010%), French (98.0%, a difference of 0.010%), and Alaska Native (98.0%, a difference of 0.010%).
DemographicsRating | Rank6th Grade
Sioux
100.0
/100
|
#23
Exceptional
98.0%
Croatians
100.0
/100
|
#24
Exceptional
98.0%
Scotch-Irish
100.0
/100
|
#25
Exceptional
98.0%
Czechs
100.0
/100
|
#26
Exceptional
98.0%
Yup'ik
100.0
/100
|
#27
Exceptional
98.0%
Scandinavians
100.0
/100
|
#28
Exceptional
98.0%
French
100.0
/100
|
#29
Exceptional
98.0%
French Canadians
100.0
/100
|
#30
Exceptional
98.0%
Europeans
100.0
/100
|
#31
Exceptional
98.0%
Alaska Natives
100.0
/100
|
#32
Exceptional
98.0%
Chippewa
100.0
/100
|
#33
Exceptional
97.9%
Swiss
100.0
/100
|
#34
Exceptional
97.9%
Chinese
100.0
/100
|
#35
Exceptional
97.9%
Italians
100.0
/100
|
#36
Exceptional
97.9%
British
100.0
/100
|
#37
Exceptional
97.9%

Demographics Similar to Immigrants from Bolivia by 6th Grade

In terms of 6th grade, the demographic groups most similar to Immigrants from Bolivia are Immigrants from Cameroon (96.3%, a difference of 0.010%), Immigrants from Philippines (96.3%, a difference of 0.010%), Immigrants from Ghana (96.3%, a difference of 0.020%), Immigrants from Hong Kong (96.3%, a difference of 0.030%), and Yaqui (96.3%, a difference of 0.030%).
DemographicsRating | Rank6th Grade
Immigrants | Jamaica
0.2
/100
|
#265
Tragic
96.4%
Ghanaians
0.2
/100
|
#266
Tragic
96.4%
Afghans
0.2
/100
|
#267
Tragic
96.4%
Immigrants | Uzbekistan
0.2
/100
|
#268
Tragic
96.3%
West Indians
0.2
/100
|
#269
Tragic
96.3%
Immigrants | South America
0.2
/100
|
#270
Tragic
96.3%
Immigrants | Hong Kong
0.2
/100
|
#271
Tragic
96.3%
Immigrants | Bolivia
0.1
/100
|
#272
Tragic
96.3%
Immigrants | Cameroon
0.1
/100
|
#273
Tragic
96.3%
Immigrants | Philippines
0.1
/100
|
#274
Tragic
96.3%
Immigrants | Ghana
0.1
/100
|
#275
Tragic
96.3%
Yaqui
0.1
/100
|
#276
Tragic
96.3%
Immigrants | Western Africa
0.1
/100
|
#277
Tragic
96.3%
Immigrants | Thailand
0.1
/100
|
#278
Tragic
96.3%
Immigrants | Peru
0.1
/100
|
#279
Tragic
96.2%