Finnish vs Immigrants from South Eastern Asia Professional Degree
COMPARE
Finnish
Immigrants from South Eastern Asia
Professional Degree
Professional Degree Comparison
Finns
Immigrants from South Eastern Asia
4.2%
PROFESSIONAL DEGREE
18.7/ 100
METRIC RATING
201st/ 347
METRIC RANK
4.0%
PROFESSIONAL DEGREE
8.9/ 100
METRIC RATING
219th/ 347
METRIC RANK
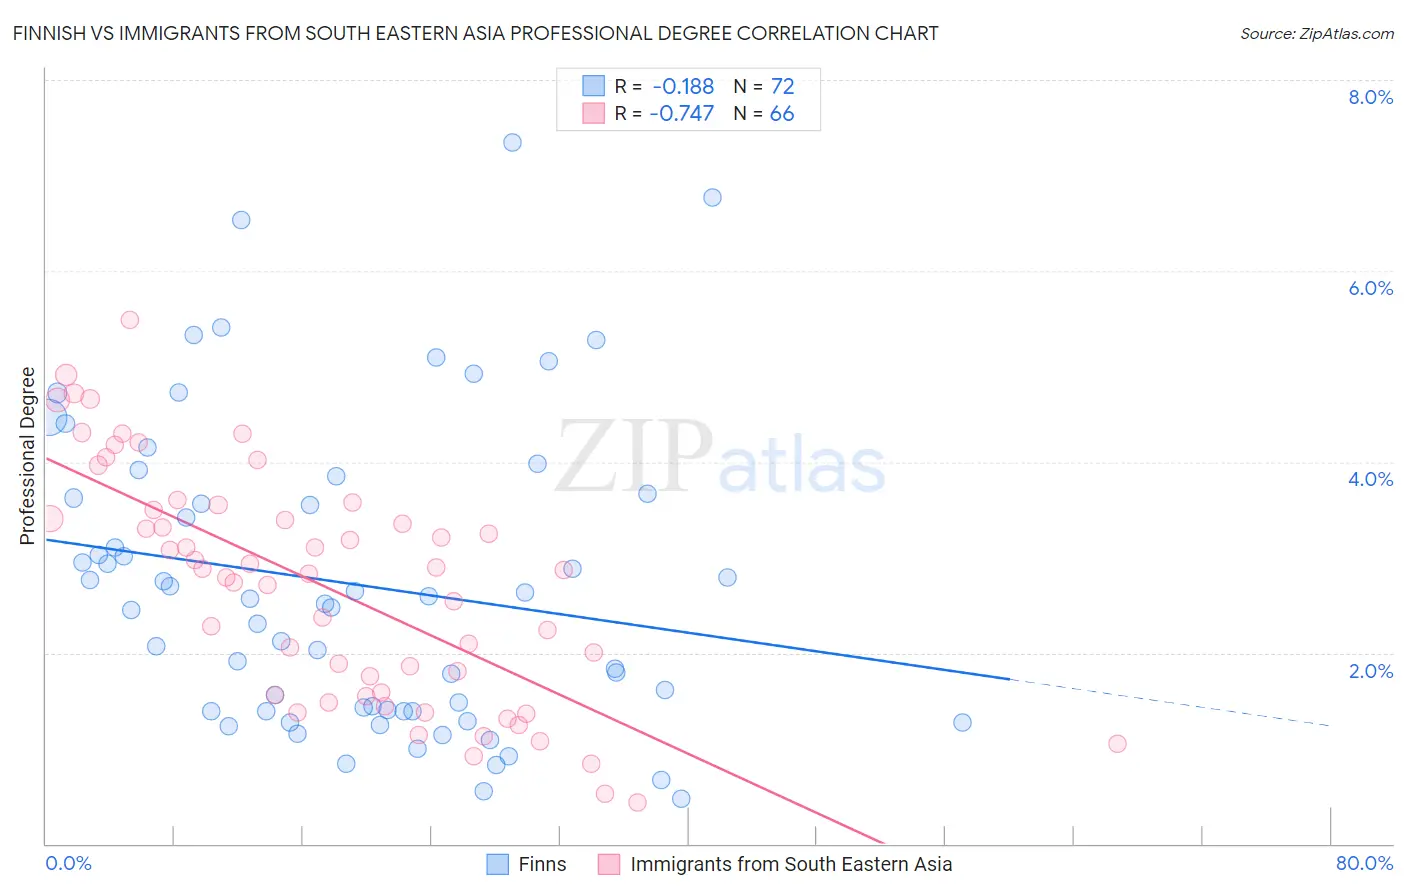
Finnish vs Immigrants from South Eastern Asia Professional Degree Correlation Chart
The statistical analysis conducted on geographies consisting of 403,408,940 people shows a poor negative correlation between the proportion of Finns and percentage of population with at least professional degree education in the United States with a correlation coefficient (R) of -0.188 and weighted average of 4.2%. Similarly, the statistical analysis conducted on geographies consisting of 509,935,466 people shows a strong negative correlation between the proportion of Immigrants from South Eastern Asia and percentage of population with at least professional degree education in the United States with a correlation coefficient (R) of -0.747 and weighted average of 4.0%, a difference of 3.4%.
Professional Degree Correlation Summary
| Measurement | Finnish | Immigrants from South Eastern Asia |
| Minimum | 0.47% | 0.44% |
| Maximum | 7.3% | 5.5% |
| Range | 6.9% | 5.0% |
| Mean | 2.7% | 2.7% |
| Median | 2.5% | 2.8% |
| Interquartile 25% (IQ1) | 1.4% | 1.6% |
| Interquartile 75% (IQ3) | 3.6% | 3.5% |
| Interquartile Range (IQR) | 2.3% | 1.9% |
| Standard Deviation (Sample) | 1.6% | 1.2% |
| Standard Deviation (Population) | 1.6% | 1.2% |
Demographics Similar to Finns and Immigrants from South Eastern Asia by Professional Degree
In terms of professional degree, the demographic groups most similar to Finns are Immigrants from North Macedonia (4.2%, a difference of 0.36%), Immigrants from Iraq (4.2%, a difference of 0.43%), Panamanian (4.1%, a difference of 0.76%), Barbadian (4.1%, a difference of 0.79%), and Somali (4.1%, a difference of 1.1%). Similarly, the demographic groups most similar to Immigrants from South Eastern Asia are Dutch (4.0%, a difference of 0.030%), Immigrants from Vietnam (4.0%, a difference of 0.24%), Ute (4.0%, a difference of 0.35%), West Indian (4.1%, a difference of 0.40%), and Portuguese (4.1%, a difference of 0.72%).
| Demographics | Rating | Rank | Professional Degree |
| Immigrants | North Macedonia | 20.2 /100 | #200 | Fair 4.2% |
| Finns | 18.7 /100 | #201 | Poor 4.2% |
| Immigrants | Iraq | 17.1 /100 | #202 | Poor 4.2% |
| Panamanians | 15.9 /100 | #203 | Poor 4.1% |
| Barbadians | 15.8 /100 | #204 | Poor 4.1% |
| Somalis | 14.8 /100 | #205 | Poor 4.1% |
| Yugoslavians | 13.4 /100 | #206 | Poor 4.1% |
| Sub-Saharan Africans | 12.8 /100 | #207 | Poor 4.1% |
| Immigrants | Somalia | 12.5 /100 | #208 | Poor 4.1% |
| Immigrants | Panama | 12.3 /100 | #209 | Poor 4.1% |
| Immigrants | Nigeria | 11.7 /100 | #210 | Poor 4.1% |
| Germans | 11.6 /100 | #211 | Poor 4.1% |
| Whites/Caucasians | 11.2 /100 | #212 | Poor 4.1% |
| Koreans | 10.7 /100 | #213 | Poor 4.1% |
| Immigrants | Ghana | 10.6 /100 | #214 | Poor 4.1% |
| Portuguese | 10.5 /100 | #215 | Poor 4.1% |
| West Indians | 9.8 /100 | #216 | Tragic 4.1% |
| Immigrants | Vietnam | 9.4 /100 | #217 | Tragic 4.0% |
| Dutch | 9.0 /100 | #218 | Tragic 4.0% |
| Immigrants | South Eastern Asia | 8.9 /100 | #219 | Tragic 4.0% |
| Ute | 8.2 /100 | #220 | Tragic 4.0% |