Filipino vs Immigrants from Guyana 11th Grade

COMPARE

Filipino
Race
Ancestry
AfghanAfricanAlaska NativeAlaskan AthabascanAlbanianAleutAlsatianAmericanApacheArabArapahoArgentineanArmenianAssyrian/Chaldean/SyriacAustralianAustrianBahamianBangladeshiBarbadianBasqueBelgianBelizeanBermudanBhutaneseBlackfeetBolivianBrazilianBritishBritish West IndianBulgarianBurmeseCajunCambodianCanadianCape VerdeanCarpatho RusynCelticCentral AmericanCentral American IndianCherokeeCheyenneChickasawChileanChineseChippewaChoctawColombianColvilleComancheCosta RicanCreeCreekCroatianCrowCubanCypriotCzechCzechoslovakianDanishDelawareDominicanDutchDutch West IndianEastern EuropeanEcuadorianEgyptianEnglishEstonianEthiopianEuropeanFijianFilipinoFinnishFrenchFrench American IndianFrench CanadianGermanGerman RussianGhanaianGreekGuamanian/ChamorroGuatemalanGuyaneseHaitianHmongHonduranHopiHoumaHungarianIcelanderIndian (Asian)IndonesianInupiatIranianIraqiIrishIroquoisIsraeliItalianJamaicanJapaneseJordanianKenyanKiowaKoreanLaotianLatvianLebaneseLiberianLithuanianLumbeeLuxembourgerMacedonianMalaysianMalteseMarshalleseMenomineeMexicanMexican American IndianMongolianMoroccanNative HawaiianNavajoNepaleseNew ZealanderNicaraguanNigerianNorthern EuropeanNorwegianOkinawanOsageOttawaPaiutePakistaniPalestinianPanamanianParaguayanPennsylvania GermanPeruvianPimaPolishPortuguesePotawatomiPuebloPuerto RicanPuget Sound SalishRomanianRussianSalvadoranSamoanScandinavianScotch-IrishScottishSeminoleSenegaleseSerbianShoshoneSierra LeoneanSiouxSlavicSlovakSloveneSomaliSouth AfricanSouth AmericanSouth American IndianSoviet UnionSpaniardSpanishSpanish AmericanSpanish American IndianSri LankanSubsaharan AfricanSudaneseSwedishSwissSyrianTaiwaneseThaiTlingit-HaidaTohono O'OdhamTonganTrinidadian and TobagonianTsimshianTurkishU.S. Virgin IslanderUgandanUkrainianUruguayanUteVenezuelanVietnameseWelshWest IndianYakamaYaquiYugoslavianYumanYup'ikZimbabwean
Immigration
NonimmigrantsImmigrantsAfghanistanAfricaAlbaniaArgentinaArmeniaAsiaAustraliaAustriaBahamasBangladeshBarbadosBelarusBelgiumBelizeBoliviaBosnia and HerzegovinaBrazilBulgariaBurma/MyanmarCabo VerdeCambodiaCameroonCanadaCaribbeanCentral AmericaChileChinaColombiaCongoCosta RicaCroatiaCubaCzechoslovakiaDenmarkDominicaDominican RepublicEastern AfricaEastern AsiaEastern EuropeEcuadorEgyptEl SalvadorEnglandEritreaEthiopiaEuropeFijiFranceGermanyGhanaGreeceGrenadaGuatemalaHaitiHondurasHong KongHungaryIndiaIndonesiaIranIraqIrelandIsraelItalyJamaicaJapanJordanKazakhstanKenyaKoreaKuwaitLaosLatin AmericaLatviaLebanonLiberiaLithuaniaMalaysiaMexicoMicronesiaMiddle AfricaMoldovaMoroccoNepalNetherlandsNicaraguaNigeriaNorth AmericaNorth MacedoniaNorthern AfricaNorthern EuropeNorwayOceaniaPakistanPanamaPeruPhilippinesPolandPortugalRomaniaRussiaSaudi ArabiaScotlandSenegalSerbiaSierra LeoneSingaporeSomaliaSouth AfricaSouth AmericaSouth Central AsiaSouth Eastern AsiaSouthern EuropeSpainSri LankaSt. Vincent and the GrenadinesSudanSwedenSwitzerlandSyriaTaiwanThailandTrinidad and TobagoTurkeyUgandaUkraineUruguayUzbekistanVenezuelaVietnamWest IndiesWestern AfricaWestern AsiaWestern EuropeYemenZaireZimbabweAzores
Immigrants from Guyana
Race
Ancestry
AfghanAfricanAlaska NativeAlaskan AthabascanAlbanianAleutAlsatianAmericanApacheArabArapahoArgentineanArmenianAssyrian/Chaldean/SyriacAustralianAustrianBahamianBangladeshiBarbadianBasqueBelgianBelizeanBermudanBhutaneseBlackfeetBolivianBrazilianBritishBritish West IndianBulgarianBurmeseCajunCambodianCanadianCape VerdeanCarpatho RusynCelticCentral AmericanCentral American IndianCherokeeCheyenneChickasawChileanChineseChippewaChoctawColombianColvilleComancheCosta RicanCreeCreekCroatianCrowCubanCypriotCzechCzechoslovakianDanishDelawareDominicanDutchDutch West IndianEastern EuropeanEcuadorianEgyptianEnglishEstonianEthiopianEuropeanFijianFinnishFrenchFrench American IndianFrench CanadianGermanGerman RussianGhanaianGreekGuamanian/ChamorroGuatemalanGuyaneseHaitianHmongHonduranHopiHoumaHungarianIcelanderIndian (Asian)IndonesianInupiatIranianIraqiIrishIroquoisIsraeliItalianJamaicanJapaneseJordanianKenyanKiowaKoreanLaotianLatvianLebaneseLiberianLithuanianLumbeeLuxembourgerMacedonianMalaysianMalteseMarshalleseMenomineeMexicanMexican American IndianMongolianMoroccanNative HawaiianNavajoNepaleseNew ZealanderNicaraguanNigerianNorthern EuropeanNorwegianOkinawanOsageOttawaPaiutePakistaniPalestinianPanamanianParaguayanPennsylvania GermanPeruvianPimaPolishPortuguesePotawatomiPuebloPuerto RicanPuget Sound SalishRomanianRussianSalvadoranSamoanScandinavianScotch-IrishScottishSeminoleSenegaleseSerbianShoshoneSierra LeoneanSiouxSlavicSlovakSloveneSomaliSouth AfricanSouth AmericanSouth American IndianSoviet UnionSpaniardSpanishSpanish AmericanSpanish American IndianSri LankanSubsaharan AfricanSudaneseSwedishSwissSyrianTaiwaneseThaiTlingit-HaidaTohono O'OdhamTonganTrinidadian and TobagonianTsimshianTurkishU.S. Virgin IslanderUgandanUkrainianUruguayanUteVenezuelanVietnameseWelshWest IndianYakamaYaquiYugoslavianYumanYup'ikZimbabwean
Immigration
NonimmigrantsImmigrantsAfghanistanAfricaAlbaniaArgentinaArmeniaAsiaAustraliaAustriaBahamasBangladeshBarbadosBelarusBelgiumBelizeBoliviaBosnia and HerzegovinaBrazilBulgariaBurma/MyanmarCabo VerdeCambodiaCameroonCanadaCaribbeanCentral AmericaChileChinaColombiaCongoCosta RicaCroatiaCubaCzechoslovakiaDenmarkDominicaDominican RepublicEastern AfricaEastern AsiaEastern EuropeEcuadorEgyptEl SalvadorEnglandEritreaEthiopiaEuropeFijiFranceGermanyGhanaGreeceGrenadaGuatemalaGuyanaHaitiHondurasHong KongHungaryIndiaIndonesiaIranIraqIrelandIsraelItalyJamaicaJapanJordanKazakhstanKenyaKoreaKuwaitLaosLatin AmericaLatviaLebanonLiberiaLithuaniaMalaysiaMexicoMicronesiaMiddle AfricaMoldovaMoroccoNepalNetherlandsNicaraguaNigeriaNorth AmericaNorth MacedoniaNorthern AfricaNorthern EuropeNorwayOceaniaPakistanPanamaPeruPhilippinesPolandPortugalRomaniaRussiaSaudi ArabiaScotlandSenegalSerbiaSierra LeoneSingaporeSomaliaSouth AfricaSouth AmericaSouth Central AsiaSouth Eastern AsiaSouthern EuropeSpainSri LankaSt. Vincent and the GrenadinesSudanSwedenSwitzerlandSyriaTaiwanThailandTrinidad and TobagoTurkeyUgandaUkraineUruguayUzbekistanVenezuelaVietnamWest IndiesWestern AfricaWestern AsiaWestern EuropeYemenZaireZimbabweAzores
11th Grade
Income
Poverty
Unemployment
Labor Participation
Family Structure
Vehicle Availability
Education Level
Disability

11th Grade Comparison

Filipinos

Immigrants from Guyana

Exceptional
Tragic
94.1%
11TH GRADE
99.9/ 100
METRIC RATING
47th/ 347
METRIC RANK
89.7%
11TH GRADE
0.0/ 100
METRIC RATING
302nd/ 347
METRIC RANK

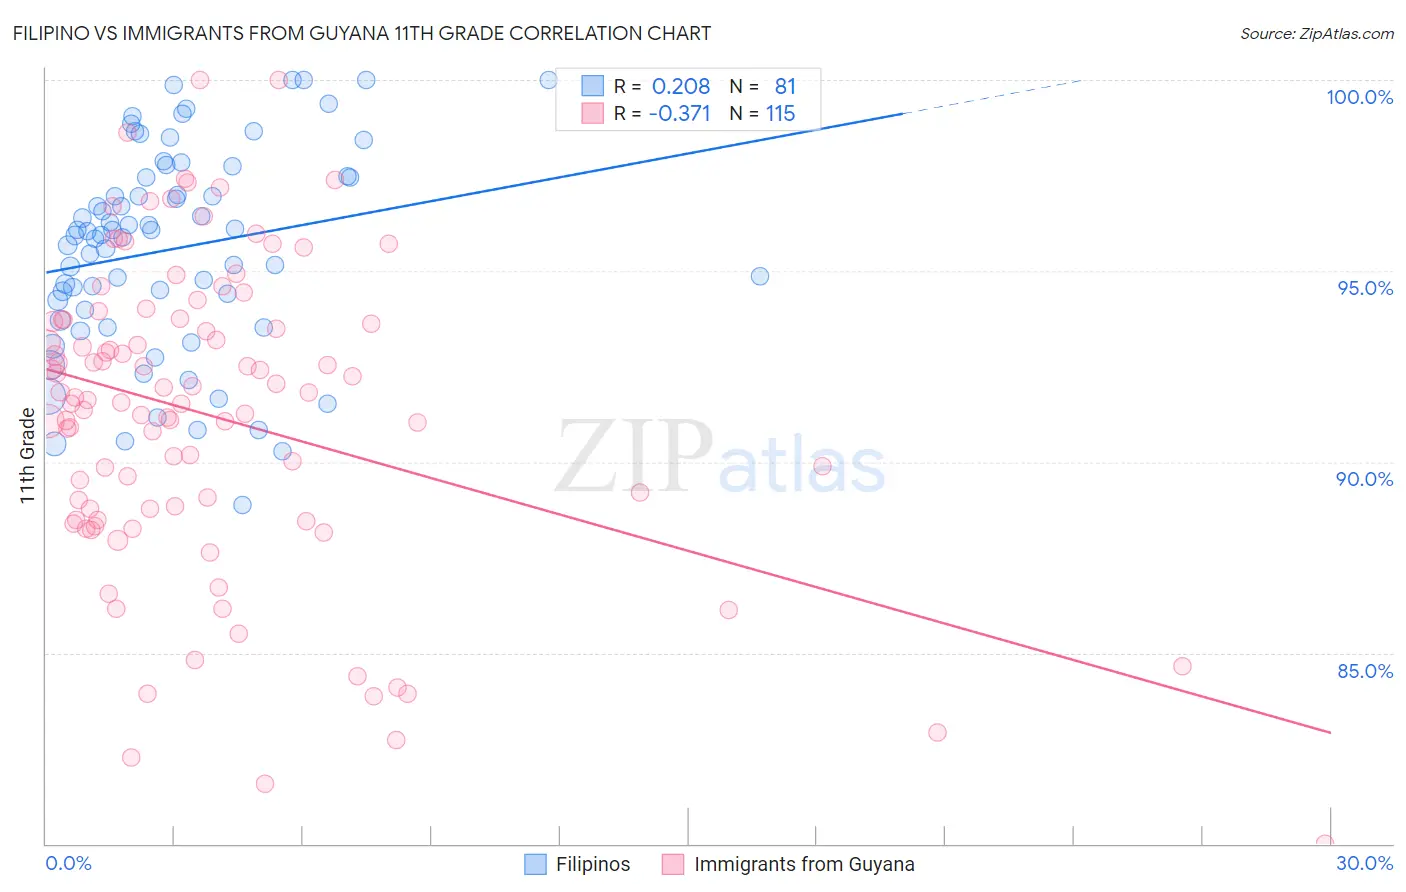
Filipino vs Immigrants from Guyana 11th Grade Correlation Chart

The statistical analysis conducted on geographies consisting of 254,351,912 people shows a weak positive correlation between the proportion of Filipinos and percentage of population with at least 11th grade education in the United States with a correlation coefficient (R) of 0.208 and weighted average of 94.1%. Similarly, the statistical analysis conducted on geographies consisting of 183,673,461 people shows a mild negative correlation between the proportion of Immigrants from Guyana and percentage of population with at least 11th grade education in the United States with a correlation coefficient (R) of -0.371 and weighted average of 89.7%, a difference of 4.9%.
Filipino vs Immigrants from Guyana 11th Grade

11th Grade Correlation Summary

MeasurementFilipinoImmigrants from Guyana
Minimum88.9%80.0%
Maximum100.0%100.0%
Range11.1%20.0%
Mean95.6%91.2%
Median95.9%91.6%
Interquartile 25% (IQ1)93.8%88.5%
Interquartile 75% (IQ3)97.5%93.7%
Interquartile Range (IQR)3.6%5.2%
Standard Deviation (Sample)2.7%4.1%
Standard Deviation (Population)2.7%4.0%

Similar Demographics by 11th Grade

Demographics Similar to Filipinos by 11th Grade

In terms of 11th grade, the demographic groups most similar to Filipinos are Macedonian (94.1%, a difference of 0.0%), Slavic (94.1%, a difference of 0.0%), Serbian (94.1%, a difference of 0.010%), French (94.1%, a difference of 0.010%), and Australian (94.1%, a difference of 0.020%).
DemographicsRating | Rank11th Grade
Thais
99.9
/100
|
#40
Exceptional
94.1%
Cypriots
99.9
/100
|
#41
Exceptional
94.1%
Immigrants | Austria
99.9
/100
|
#42
Exceptional
94.1%
Greeks
99.9
/100
|
#43
Exceptional
94.1%
Immigrants | Ireland
99.9
/100
|
#44
Exceptional
94.1%
Australians
99.9
/100
|
#45
Exceptional
94.1%
Serbians
99.9
/100
|
#46
Exceptional
94.1%
Filipinos
99.9
/100
|
#47
Exceptional
94.1%
Macedonians
99.9
/100
|
#48
Exceptional
94.1%
Slavs
99.9
/100
|
#49
Exceptional
94.1%
French
99.9
/100
|
#50
Exceptional
94.1%
Turks
99.9
/100
|
#51
Exceptional
94.0%
Immigrants | Canada
99.9
/100
|
#52
Exceptional
94.0%
Immigrants | Australia
99.9
/100
|
#53
Exceptional
94.0%
Immigrants | North America
99.9
/100
|
#54
Exceptional
94.0%

Demographics Similar to Immigrants from Guyana by 11th Grade

In terms of 11th grade, the demographic groups most similar to Immigrants from Guyana are Immigrants (89.7%, a difference of 0.010%), Yuman (89.7%, a difference of 0.010%), Immigrants from Cambodia (89.6%, a difference of 0.090%), Ecuadorian (89.6%, a difference of 0.14%), and Guyanese (89.9%, a difference of 0.19%).
DemographicsRating | Rank11th Grade
Immigrants | Vietnam
0.0
/100
|
#295
Tragic
90.0%
Fijians
0.0
/100
|
#296
Tragic
90.0%
Navajo
0.0
/100
|
#297
Tragic
90.0%
Immigrants | Fiji
0.0
/100
|
#298
Tragic
89.9%
Japanese
0.0
/100
|
#299
Tragic
89.9%
Immigrants | Haiti
0.0
/100
|
#300
Tragic
89.9%
Guyanese
0.0
/100
|
#301
Tragic
89.9%
Immigrants | Guyana
0.0
/100
|
#302
Tragic
89.7%
Immigrants | Immigrants
0.0
/100
|
#303
Tragic
89.7%
Yuman
0.0
/100
|
#304
Tragic
89.7%
Immigrants | Cambodia
0.0
/100
|
#305
Tragic
89.6%
Ecuadorians
0.0
/100
|
#306
Tragic
89.6%
Immigrants | Dominica
0.0
/100
|
#307
Tragic
89.5%
Nepalese
0.0
/100
|
#308
Tragic
89.5%
Immigrants | Bangladesh
0.0
/100
|
#309
Tragic
89.5%