Filipino vs Immigrants from Cuba 7th Grade

COMPARE

Filipino
Race
Ancestry
AfghanAfricanAlaska NativeAlaskan AthabascanAlbanianAleutAlsatianAmericanApacheArabArapahoArgentineanArmenianAssyrian/Chaldean/SyriacAustralianAustrianBahamianBangladeshiBarbadianBasqueBelgianBelizeanBermudanBhutaneseBlackfeetBolivianBrazilianBritishBritish West IndianBulgarianBurmeseCajunCambodianCanadianCape VerdeanCarpatho RusynCelticCentral AmericanCentral American IndianCherokeeCheyenneChickasawChileanChineseChippewaChoctawColombianColvilleComancheCosta RicanCreeCreekCroatianCrowCubanCypriotCzechCzechoslovakianDanishDelawareDominicanDutchDutch West IndianEastern EuropeanEcuadorianEgyptianEnglishEstonianEthiopianEuropeanFijianFilipinoFinnishFrenchFrench American IndianFrench CanadianGermanGerman RussianGhanaianGreekGuamanian/ChamorroGuatemalanGuyaneseHaitianHmongHonduranHopiHoumaHungarianIcelanderIndian (Asian)IndonesianInupiatIranianIraqiIrishIroquoisIsraeliItalianJamaicanJapaneseJordanianKenyanKiowaKoreanLaotianLatvianLebaneseLiberianLithuanianLumbeeLuxembourgerMacedonianMalaysianMalteseMarshalleseMenomineeMexicanMexican American IndianMongolianMoroccanNative HawaiianNavajoNepaleseNew ZealanderNicaraguanNigerianNorthern EuropeanNorwegianOkinawanOsageOttawaPaiutePakistaniPalestinianPanamanianParaguayanPennsylvania GermanPeruvianPimaPolishPortuguesePotawatomiPuebloPuerto RicanPuget Sound SalishRomanianRussianSalvadoranSamoanScandinavianScotch-IrishScottishSeminoleSenegaleseSerbianShoshoneSierra LeoneanSiouxSlavicSlovakSloveneSomaliSouth AfricanSouth AmericanSouth American IndianSoviet UnionSpaniardSpanishSpanish AmericanSpanish American IndianSri LankanSubsaharan AfricanSudaneseSwedishSwissSyrianTaiwaneseThaiTlingit-HaidaTohono O'OdhamTonganTrinidadian and TobagonianTsimshianTurkishU.S. Virgin IslanderUgandanUkrainianUruguayanUteVenezuelanVietnameseWelshWest IndianYakamaYaquiYugoslavianYumanYup'ikZimbabwean
Immigration
NonimmigrantsImmigrantsAfghanistanAfricaAlbaniaArgentinaArmeniaAsiaAustraliaAustriaBahamasBangladeshBarbadosBelarusBelgiumBelizeBoliviaBosnia and HerzegovinaBrazilBulgariaBurma/MyanmarCabo VerdeCambodiaCameroonCanadaCaribbeanCentral AmericaChileChinaColombiaCongoCosta RicaCroatiaCzechoslovakiaDenmarkDominicaDominican RepublicEastern AfricaEastern AsiaEastern EuropeEcuadorEgyptEl SalvadorEnglandEritreaEthiopiaEuropeFijiFranceGermanyGhanaGreeceGrenadaGuatemalaGuyanaHaitiHondurasHong KongHungaryIndiaIndonesiaIranIraqIrelandIsraelItalyJamaicaJapanJordanKazakhstanKenyaKoreaKuwaitLaosLatin AmericaLatviaLebanonLiberiaLithuaniaMalaysiaMexicoMicronesiaMiddle AfricaMoldovaMoroccoNepalNetherlandsNicaraguaNigeriaNorth AmericaNorth MacedoniaNorthern AfricaNorthern EuropeNorwayOceaniaPakistanPanamaPeruPhilippinesPolandPortugalRomaniaRussiaSaudi ArabiaScotlandSenegalSerbiaSierra LeoneSingaporeSomaliaSouth AfricaSouth AmericaSouth Central AsiaSouth Eastern AsiaSouthern EuropeSpainSri LankaSt. Vincent and the GrenadinesSudanSwedenSwitzerlandSyriaTaiwanThailandTrinidad and TobagoTurkeyUgandaUkraineUruguayUzbekistanVenezuelaVietnamWest IndiesWestern AfricaWestern AsiaWestern EuropeYemenZaireZimbabweAzores
Immigrants from Cuba
Race
Ancestry
AfghanAfricanAlaska NativeAlaskan AthabascanAlbanianAleutAlsatianAmericanApacheArabArapahoArgentineanArmenianAssyrian/Chaldean/SyriacAustralianAustrianBahamianBangladeshiBarbadianBasqueBelgianBelizeanBermudanBhutaneseBlackfeetBolivianBrazilianBritishBritish West IndianBulgarianBurmeseCajunCambodianCanadianCape VerdeanCarpatho RusynCelticCentral AmericanCentral American IndianCherokeeCheyenneChickasawChileanChineseChippewaChoctawColombianColvilleComancheCosta RicanCreeCreekCroatianCrowCubanCypriotCzechCzechoslovakianDanishDelawareDominicanDutchDutch West IndianEastern EuropeanEcuadorianEgyptianEnglishEstonianEthiopianEuropeanFijianFinnishFrenchFrench American IndianFrench CanadianGermanGerman RussianGhanaianGreekGuamanian/ChamorroGuatemalanGuyaneseHaitianHmongHonduranHopiHoumaHungarianIcelanderIndian (Asian)IndonesianInupiatIranianIraqiIrishIroquoisIsraeliItalianJamaicanJapaneseJordanianKenyanKiowaKoreanLaotianLatvianLebaneseLiberianLithuanianLumbeeLuxembourgerMacedonianMalaysianMalteseMarshalleseMenomineeMexicanMexican American IndianMongolianMoroccanNative HawaiianNavajoNepaleseNew ZealanderNicaraguanNigerianNorthern EuropeanNorwegianOkinawanOsageOttawaPaiutePakistaniPalestinianPanamanianParaguayanPennsylvania GermanPeruvianPimaPolishPortuguesePotawatomiPuebloPuerto RicanPuget Sound SalishRomanianRussianSalvadoranSamoanScandinavianScotch-IrishScottishSeminoleSenegaleseSerbianShoshoneSierra LeoneanSiouxSlavicSlovakSloveneSomaliSouth AfricanSouth AmericanSouth American IndianSoviet UnionSpaniardSpanishSpanish AmericanSpanish American IndianSri LankanSubsaharan AfricanSudaneseSwedishSwissSyrianTaiwaneseThaiTlingit-HaidaTohono O'OdhamTonganTrinidadian and TobagonianTsimshianTurkishU.S. Virgin IslanderUgandanUkrainianUruguayanUteVenezuelanVietnameseWelshWest IndianYakamaYaquiYugoslavianYumanYup'ikZimbabwean
Immigration
NonimmigrantsImmigrantsAfghanistanAfricaAlbaniaArgentinaArmeniaAsiaAustraliaAustriaBahamasBangladeshBarbadosBelarusBelgiumBelizeBoliviaBosnia and HerzegovinaBrazilBulgariaBurma/MyanmarCabo VerdeCambodiaCameroonCanadaCaribbeanCentral AmericaChileChinaColombiaCongoCosta RicaCroatiaCubaCzechoslovakiaDenmarkDominicaDominican RepublicEastern AfricaEastern AsiaEastern EuropeEcuadorEgyptEl SalvadorEnglandEritreaEthiopiaEuropeFijiFranceGermanyGhanaGreeceGrenadaGuatemalaGuyanaHaitiHondurasHong KongHungaryIndiaIndonesiaIranIraqIrelandIsraelItalyJamaicaJapanJordanKazakhstanKenyaKoreaKuwaitLaosLatin AmericaLatviaLebanonLiberiaLithuaniaMalaysiaMexicoMicronesiaMiddle AfricaMoldovaMoroccoNepalNetherlandsNicaraguaNigeriaNorth AmericaNorth MacedoniaNorthern AfricaNorthern EuropeNorwayOceaniaPakistanPanamaPeruPhilippinesPolandPortugalRomaniaRussiaSaudi ArabiaScotlandSenegalSerbiaSierra LeoneSingaporeSomaliaSouth AfricaSouth AmericaSouth Central AsiaSouth Eastern AsiaSouthern EuropeSpainSri LankaSt. Vincent and the GrenadinesSudanSwedenSwitzerlandSyriaTaiwanThailandTrinidad and TobagoTurkeyUgandaUkraineUruguayUzbekistanVenezuelaVietnamWest IndiesWestern AfricaWestern AsiaWestern EuropeYemenZaireZimbabweAzores
7th Grade
Income
Poverty
Unemployment
Labor Participation
Family Structure
Vehicle Availability
Education Level
Disability

7th Grade Comparison

Filipinos

Immigrants from Cuba

Exceptional
Tragic
96.4%
7TH GRADE
92.1/ 100
METRIC RATING
131st/ 347
METRIC RANK
93.8%
7TH GRADE
0.0/ 100
METRIC RATING
317th/ 347
METRIC RANK

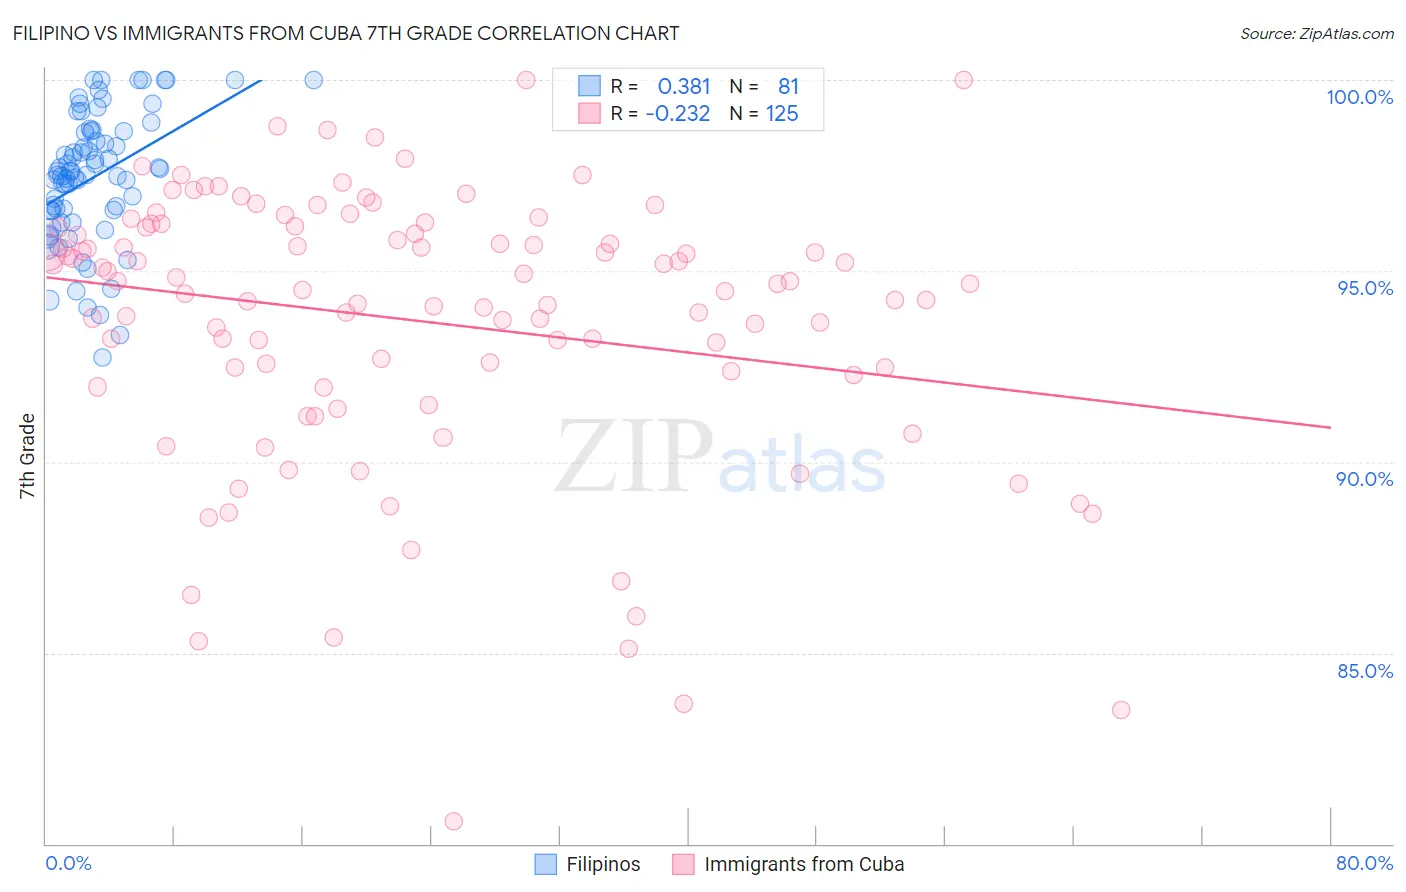
Filipino vs Immigrants from Cuba 7th Grade Correlation Chart

The statistical analysis conducted on geographies consisting of 254,351,427 people shows a mild positive correlation between the proportion of Filipinos and percentage of population with at least 7th grade education in the United States with a correlation coefficient (R) of 0.381 and weighted average of 96.4%. Similarly, the statistical analysis conducted on geographies consisting of 326,028,159 people shows a weak negative correlation between the proportion of Immigrants from Cuba and percentage of population with at least 7th grade education in the United States with a correlation coefficient (R) of -0.232 and weighted average of 93.8%, a difference of 2.8%.
Filipino vs Immigrants from Cuba 7th Grade

7th Grade Correlation Summary

MeasurementFilipinoImmigrants from Cuba
Minimum92.7%80.6%
Maximum100.0%100.0%
Range7.3%19.4%
Mean97.5%93.7%
Median97.6%94.7%
Interquartile 25% (IQ1)96.6%92.3%
Interquartile 75% (IQ3)98.7%96.1%
Interquartile Range (IQR)2.1%3.8%
Standard Deviation (Sample)1.7%3.6%
Standard Deviation (Population)1.7%3.6%

Similar Demographics by 7th Grade

Demographics Similar to Filipinos by 7th Grade

In terms of 7th grade, the demographic groups most similar to Filipinos are Colville (96.4%, a difference of 0.010%), Hmong (96.4%, a difference of 0.010%), Immigrants from Romania (96.4%, a difference of 0.020%), Immigrants from North Macedonia (96.4%, a difference of 0.020%), and Immigrants from Serbia (96.4%, a difference of 0.020%).
DemographicsRating | Rank7th Grade
Immigrants | Switzerland
94.5
/100
|
#124
Exceptional
96.5%
Immigrants | Bulgaria
94.0
/100
|
#125
Exceptional
96.4%
Palestinians
93.5
/100
|
#126
Exceptional
96.4%
Immigrants | Bosnia and Herzegovina
93.3
/100
|
#127
Exceptional
96.4%
Immigrants | Romania
93.2
/100
|
#128
Exceptional
96.4%
Immigrants | North Macedonia
93.1
/100
|
#129
Exceptional
96.4%
Immigrants | Serbia
92.8
/100
|
#130
Exceptional
96.4%
Filipinos
92.1
/100
|
#131
Exceptional
96.4%
Colville
91.7
/100
|
#132
Exceptional
96.4%
Hmong
91.5
/100
|
#133
Exceptional
96.4%
Soviet Union
91.2
/100
|
#134
Exceptional
96.4%
Immigrants | Kuwait
91.1
/100
|
#135
Exceptional
96.4%
Immigrants | Hungary
90.6
/100
|
#136
Exceptional
96.4%
Immigrants | Turkey
90.2
/100
|
#137
Exceptional
96.4%
Jordanians
90.0
/100
|
#138
Excellent
96.4%

Demographics Similar to Immigrants from Cuba by 7th Grade

In terms of 7th grade, the demographic groups most similar to Immigrants from Cuba are Immigrants from Ecuador (93.7%, a difference of 0.080%), Immigrants from Vietnam (93.9%, a difference of 0.090%), Vietnamese (93.9%, a difference of 0.11%), Immigrants from Cambodia (93.7%, a difference of 0.11%), and Japanese (94.0%, a difference of 0.17%).
DemographicsRating | Rank7th Grade
Immigrants | Caribbean
0.0
/100
|
#310
Tragic
94.0%
Puerto Ricans
0.0
/100
|
#311
Tragic
94.0%
Immigrants | Immigrants
0.0
/100
|
#312
Tragic
94.0%
Immigrants | Bangladesh
0.0
/100
|
#313
Tragic
94.0%
Japanese
0.0
/100
|
#314
Tragic
94.0%
Vietnamese
0.0
/100
|
#315
Tragic
93.9%
Immigrants | Vietnam
0.0
/100
|
#316
Tragic
93.9%
Immigrants | Cuba
0.0
/100
|
#317
Tragic
93.8%
Immigrants | Ecuador
0.0
/100
|
#318
Tragic
93.7%
Immigrants | Cambodia
0.0
/100
|
#319
Tragic
93.7%
Immigrants | Fiji
0.0
/100
|
#320
Tragic
93.5%
Belizeans
0.0
/100
|
#321
Tragic
93.5%
Nicaraguans
0.0
/100
|
#322
Tragic
93.5%
Immigrants | Belize
0.0
/100
|
#323
Tragic
93.4%
Dominicans
0.0
/100
|
#324
Tragic
93.3%