Fijian vs Serbian Nursery School
COMPARE
Fijian
Serbian
Nursery School
Nursery School Comparison
Fijians
Serbians
97.6%
NURSERY SCHOOL
0.3/ 100
METRIC RATING
263rd/ 347
METRIC RANK
98.4%
NURSERY SCHOOL
99.6/ 100
METRIC RATING
71st/ 347
METRIC RANK
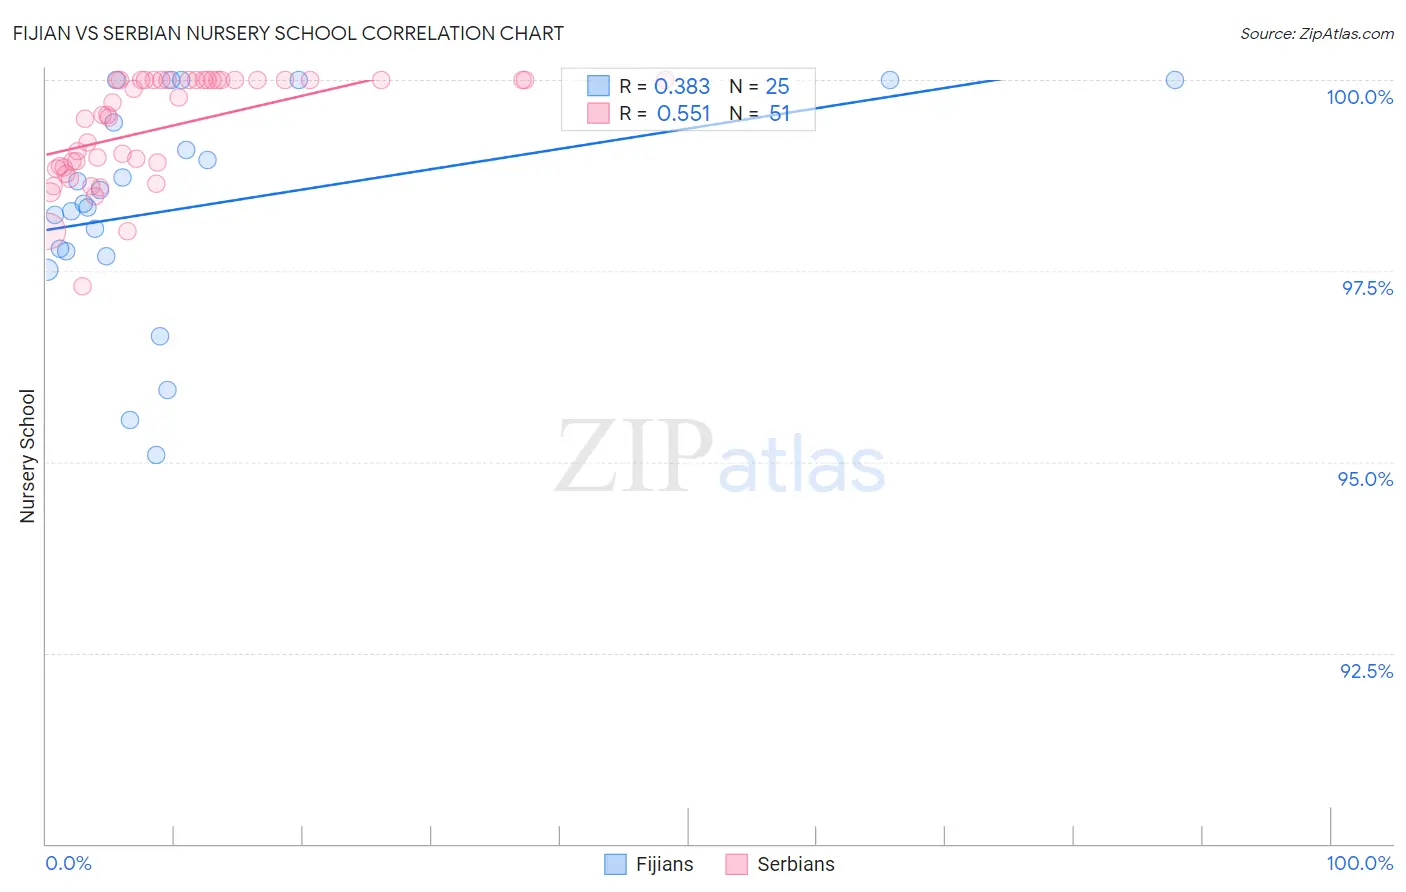
Fijian vs Serbian Nursery School Correlation Chart
The statistical analysis conducted on geographies consisting of 55,948,842 people shows a mild positive correlation between the proportion of Fijians and percentage of population with at least nursery school education in the United States with a correlation coefficient (R) of 0.383 and weighted average of 97.6%. Similarly, the statistical analysis conducted on geographies consisting of 267,642,942 people shows a substantial positive correlation between the proportion of Serbians and percentage of population with at least nursery school education in the United States with a correlation coefficient (R) of 0.551 and weighted average of 98.4%, a difference of 0.85%.
Nursery School Correlation Summary
| Measurement | Fijian | Serbian |
| Minimum | 95.1% | 97.3% |
| Maximum | 100.0% | 100.0% |
| Range | 4.9% | 2.7% |
| Mean | 98.3% | 99.4% |
| Median | 98.4% | 99.5% |
| Interquartile 25% (IQ1) | 97.7% | 98.8% |
| Interquartile 75% (IQ3) | 99.7% | 100.0% |
| Interquartile Range (IQR) | 2.0% | 1.2% |
| Standard Deviation (Sample) | 1.4% | 0.69% |
| Standard Deviation (Population) | 1.4% | 0.68% |
Similar Demographics by Nursery School
Demographics Similar to Fijians by Nursery School
In terms of nursery school, the demographic groups most similar to Fijians are Immigrants from Ethiopia (97.6%, a difference of 0.0%), Taiwanese (97.6%, a difference of 0.0%), Assyrian/Chaldean/Syriac (97.6%, a difference of 0.0%), Immigrants from South America (97.6%, a difference of 0.010%), and Cuban (97.6%, a difference of 0.010%).
| Demographics | Rating | Rank | Nursery School |
| Yaqui | 0.6 /100 | #256 | Tragic 97.6% |
| Immigrants | Colombia | 0.6 /100 | #257 | Tragic 97.6% |
| Jamaicans | 0.6 /100 | #258 | Tragic 97.6% |
| Armenians | 0.4 /100 | #259 | Tragic 97.6% |
| Immigrants | South America | 0.4 /100 | #260 | Tragic 97.6% |
| Cubans | 0.4 /100 | #261 | Tragic 97.6% |
| Immigrants | Ethiopia | 0.4 /100 | #262 | Tragic 97.6% |
| Fijians | 0.3 /100 | #263 | Tragic 97.6% |
| Taiwanese | 0.3 /100 | #264 | Tragic 97.6% |
| Assyrians/Chaldeans/Syriacs | 0.3 /100 | #265 | Tragic 97.6% |
| Immigrants | Sierra Leone | 0.3 /100 | #266 | Tragic 97.6% |
| Immigrants | Nigeria | 0.3 /100 | #267 | Tragic 97.5% |
| West Indians | 0.3 /100 | #268 | Tragic 97.5% |
| Immigrants | Liberia | 0.3 /100 | #269 | Tragic 97.5% |
| Immigrants | Jamaica | 0.2 /100 | #270 | Tragic 97.5% |
Demographics Similar to Serbians by Nursery School
In terms of nursery school, the demographic groups most similar to Serbians are Russian (98.4%, a difference of 0.0%), Immigrants from Austria (98.4%, a difference of 0.0%), Cheyenne (98.4%, a difference of 0.0%), Chickasaw (98.4%, a difference of 0.0%), and Canadian (98.4%, a difference of 0.010%).
| Demographics | Rating | Rank | Nursery School |
| Greeks | 99.7 /100 | #64 | Exceptional 98.4% |
| Maltese | 99.7 /100 | #65 | Exceptional 98.4% |
| Canadians | 99.7 /100 | #66 | Exceptional 98.4% |
| Immigrants | Northern Europe | 99.6 /100 | #67 | Exceptional 98.4% |
| Russians | 99.6 /100 | #68 | Exceptional 98.4% |
| Immigrants | Austria | 99.6 /100 | #69 | Exceptional 98.4% |
| Cheyenne | 99.6 /100 | #70 | Exceptional 98.4% |
| Serbians | 99.6 /100 | #71 | Exceptional 98.4% |
| Chickasaw | 99.6 /100 | #72 | Exceptional 98.4% |
| Cajuns | 99.4 /100 | #73 | Exceptional 98.4% |
| Immigrants | Netherlands | 99.4 /100 | #74 | Exceptional 98.4% |
| Cherokee | 99.3 /100 | #75 | Exceptional 98.3% |
| Immigrants | England | 99.3 /100 | #76 | Exceptional 98.3% |
| Immigrants | Lithuania | 99.3 /100 | #77 | Exceptional 98.3% |
| Delaware | 99.3 /100 | #78 | Exceptional 98.3% |