Fijian vs Immigrants from Eastern Africa 11th Grade
COMPARE
Fijian
Immigrants from Eastern Africa
11th Grade
11th Grade Comparison
Fijians
Immigrants from Eastern Africa
90.0%
11TH GRADE
0.0/ 100
METRIC RATING
296th/ 347
METRIC RANK
92.3%
11TH GRADE
24.1/ 100
METRIC RATING
202nd/ 347
METRIC RANK
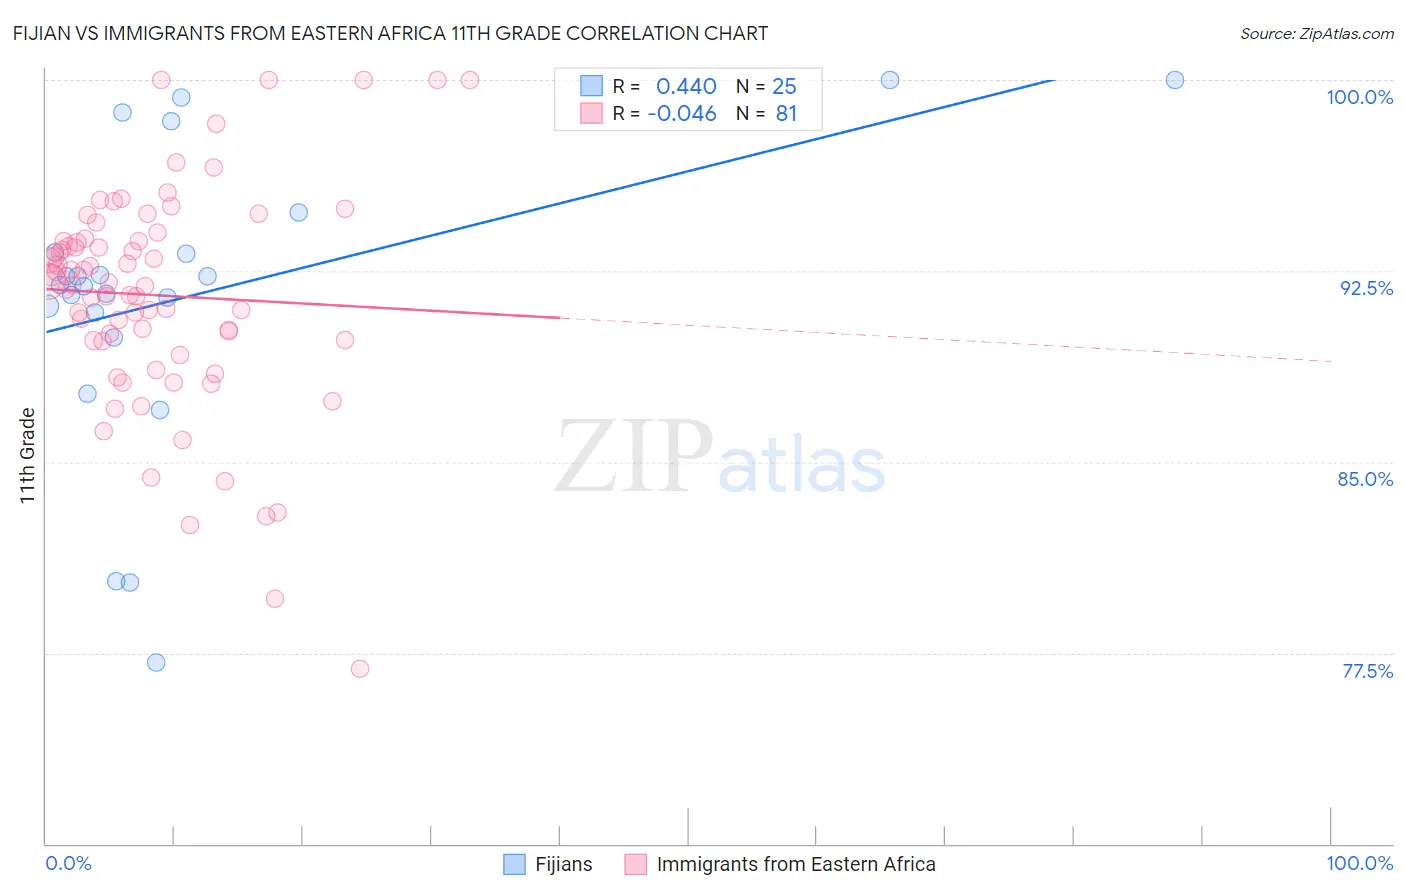
Fijian vs Immigrants from Eastern Africa 11th Grade Correlation Chart
The statistical analysis conducted on geographies consisting of 55,948,842 people shows a moderate positive correlation between the proportion of Fijians and percentage of population with at least 11th grade education in the United States with a correlation coefficient (R) of 0.440 and weighted average of 90.0%. Similarly, the statistical analysis conducted on geographies consisting of 355,144,184 people shows no correlation between the proportion of Immigrants from Eastern Africa and percentage of population with at least 11th grade education in the United States with a correlation coefficient (R) of -0.046 and weighted average of 92.3%, a difference of 2.5%.
11th Grade Correlation Summary
| Measurement | Fijian | Immigrants from Eastern Africa |
| Minimum | 77.1% | 76.9% |
| Maximum | 100.0% | 100.0% |
| Range | 22.9% | 23.1% |
| Mean | 91.6% | 91.5% |
| Median | 92.0% | 92.1% |
| Interquartile 25% (IQ1) | 90.4% | 89.7% |
| Interquartile 75% (IQ3) | 94.0% | 93.7% |
| Interquartile Range (IQR) | 3.6% | 4.0% |
| Standard Deviation (Sample) | 5.8% | 4.4% |
| Standard Deviation (Population) | 5.7% | 4.4% |
Similar Demographics by 11th Grade
Demographics Similar to Fijians by 11th Grade
In terms of 11th grade, the demographic groups most similar to Fijians are Immigrants from Vietnam (90.0%, a difference of 0.020%), Navajo (90.0%, a difference of 0.040%), Immigrants from Fiji (89.9%, a difference of 0.11%), Immigrants from Grenada (90.1%, a difference of 0.12%), and Japanese (89.9%, a difference of 0.14%).
| Demographics | Rating | Rank | 11th Grade |
| British West Indians | 0.0 /100 | #289 | Tragic 90.3% |
| Indonesians | 0.0 /100 | #290 | Tragic 90.3% |
| Haitians | 0.0 /100 | #291 | Tragic 90.3% |
| Cubans | 0.0 /100 | #292 | Tragic 90.2% |
| Natives/Alaskans | 0.0 /100 | #293 | Tragic 90.2% |
| Immigrants | Grenada | 0.0 /100 | #294 | Tragic 90.1% |
| Immigrants | Vietnam | 0.0 /100 | #295 | Tragic 90.0% |
| Fijians | 0.0 /100 | #296 | Tragic 90.0% |
| Navajo | 0.0 /100 | #297 | Tragic 90.0% |
| Immigrants | Fiji | 0.0 /100 | #298 | Tragic 89.9% |
| Japanese | 0.0 /100 | #299 | Tragic 89.9% |
| Immigrants | Haiti | 0.0 /100 | #300 | Tragic 89.9% |
| Guyanese | 0.0 /100 | #301 | Tragic 89.9% |
| Immigrants | Guyana | 0.0 /100 | #302 | Tragic 89.7% |
| Immigrants | Immigrants | 0.0 /100 | #303 | Tragic 89.7% |
Demographics Similar to Immigrants from Eastern Africa by 11th Grade
In terms of 11th grade, the demographic groups most similar to Immigrants from Eastern Africa are Samoan (92.3%, a difference of 0.010%), Immigrants from China (92.3%, a difference of 0.010%), Immigrants from Sudan (92.3%, a difference of 0.010%), Immigrants from Hong Kong (92.2%, a difference of 0.010%), and Kiowa (92.2%, a difference of 0.010%).
| Demographics | Rating | Rank | 11th Grade |
| Liberians | 26.8 /100 | #195 | Fair 92.3% |
| Panamanians | 26.4 /100 | #196 | Fair 92.3% |
| Marshallese | 26.0 /100 | #197 | Fair 92.3% |
| Hawaiians | 25.5 /100 | #198 | Fair 92.3% |
| Immigrants | Uganda | 25.2 /100 | #199 | Fair 92.3% |
| Samoans | 25.1 /100 | #200 | Fair 92.3% |
| Immigrants | China | 25.1 /100 | #201 | Fair 92.3% |
| Immigrants | Eastern Africa | 24.1 /100 | #202 | Fair 92.3% |
| Immigrants | Sudan | 23.5 /100 | #203 | Fair 92.3% |
| Immigrants | Hong Kong | 23.3 /100 | #204 | Fair 92.2% |
| Kiowa | 23.2 /100 | #205 | Fair 92.2% |
| Bolivians | 23.2 /100 | #206 | Fair 92.2% |
| Immigrants | Oceania | 22.4 /100 | #207 | Fair 92.2% |
| Colville | 21.8 /100 | #208 | Fair 92.2% |
| Tongans | 19.8 /100 | #209 | Poor 92.2% |