European vs Immigrants from Nicaragua Doctorate Degree
COMPARE
European
Immigrants from Nicaragua
Doctorate Degree
Doctorate Degree Comparison
Europeans
Immigrants from Nicaragua
2.1%
DOCTORATE DEGREE
97.5/ 100
METRIC RATING
107th/ 347
METRIC RANK
1.4%
DOCTORATE DEGREE
0.1/ 100
METRIC RATING
312th/ 347
METRIC RANK
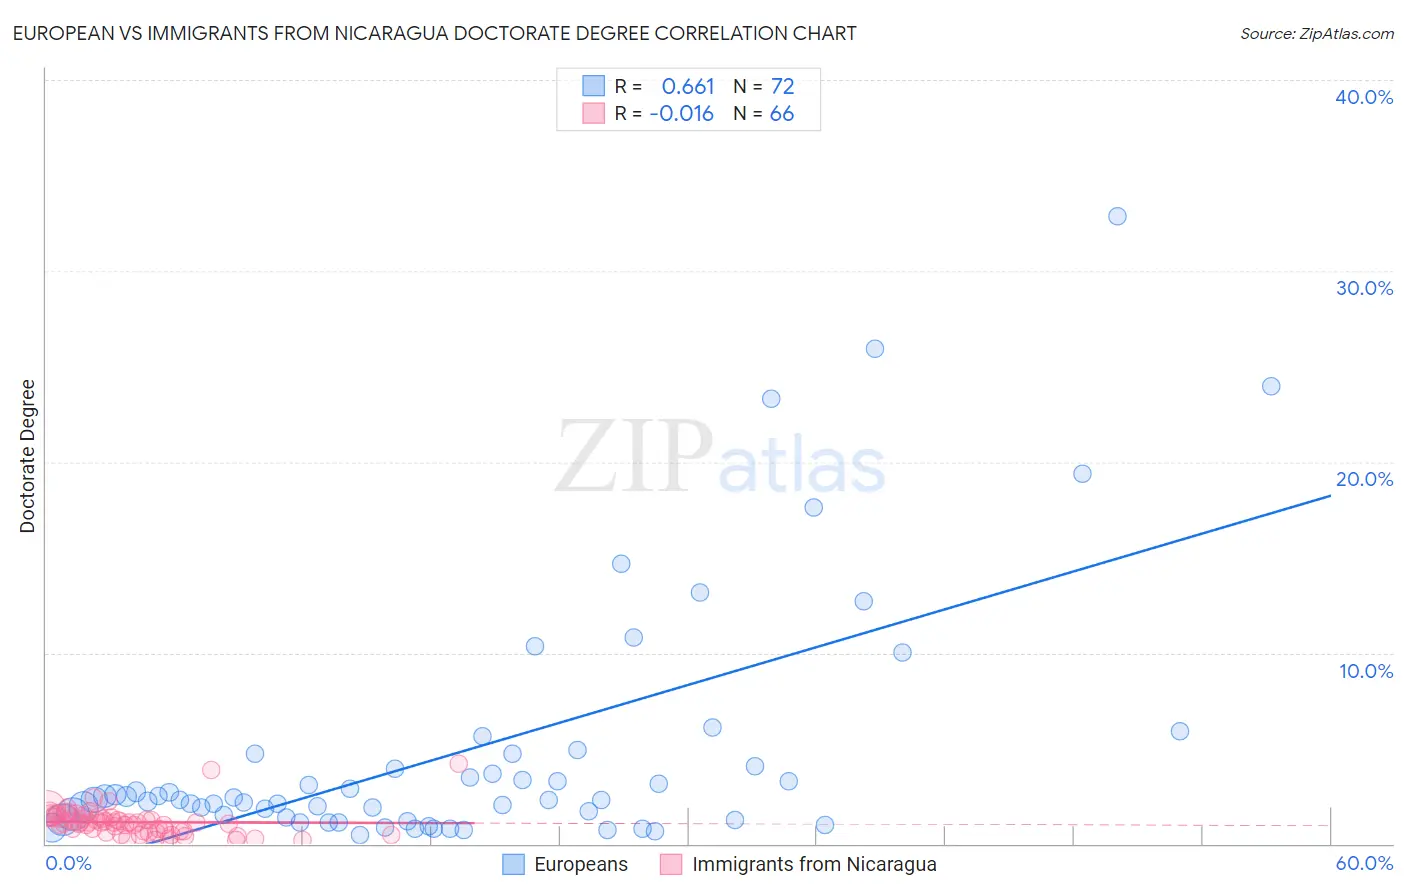
European vs Immigrants from Nicaragua Doctorate Degree Correlation Chart
The statistical analysis conducted on geographies consisting of 540,466,833 people shows a significant positive correlation between the proportion of Europeans and percentage of population with at least doctorate degree education in the United States with a correlation coefficient (R) of 0.661 and weighted average of 2.1%. Similarly, the statistical analysis conducted on geographies consisting of 234,843,041 people shows no correlation between the proportion of Immigrants from Nicaragua and percentage of population with at least doctorate degree education in the United States with a correlation coefficient (R) of -0.016 and weighted average of 1.4%, a difference of 53.4%.
Doctorate Degree Correlation Summary
| Measurement | European | Immigrants from Nicaragua |
| Minimum | 0.48% | 0.18% |
| Maximum | 32.8% | 4.2% |
| Range | 32.4% | 4.0% |
| Mean | 4.9% | 1.1% |
| Median | 2.3% | 1.1% |
| Interquartile 25% (IQ1) | 1.3% | 0.66% |
| Interquartile 75% (IQ3) | 4.4% | 1.4% |
| Interquartile Range (IQR) | 3.1% | 0.74% |
| Standard Deviation (Sample) | 6.6% | 0.71% |
| Standard Deviation (Population) | 6.6% | 0.71% |
Similar Demographics by Doctorate Degree
Demographics Similar to Europeans by Doctorate Degree
In terms of doctorate degree, the demographic groups most similar to Europeans are Immigrants from Germany (2.1%, a difference of 0.22%), Ukrainian (2.1%, a difference of 0.28%), Brazilian (2.1%, a difference of 0.35%), Sudanese (2.1%, a difference of 0.39%), and Immigrants from Pakistan (2.1%, a difference of 0.41%).
| Demographics | Rating | Rank | Doctorate Degree |
| Immigrants | Eastern Europe | 98.2 /100 | #100 | Exceptional 2.1% |
| Immigrants | Eastern Africa | 98.2 /100 | #101 | Exceptional 2.1% |
| Immigrants | Chile | 98.1 /100 | #102 | Exceptional 2.1% |
| Romanians | 98.1 /100 | #103 | Exceptional 2.1% |
| Austrians | 98.0 /100 | #104 | Exceptional 2.1% |
| Arabs | 97.8 /100 | #105 | Exceptional 2.1% |
| Sudanese | 97.7 /100 | #106 | Exceptional 2.1% |
| Europeans | 97.5 /100 | #107 | Exceptional 2.1% |
| Immigrants | Germany | 97.3 /100 | #108 | Exceptional 2.1% |
| Ukrainians | 97.2 /100 | #109 | Exceptional 2.1% |
| Brazilians | 97.2 /100 | #110 | Exceptional 2.1% |
| Immigrants | Pakistan | 97.1 /100 | #111 | Exceptional 2.1% |
| Syrians | 97.1 /100 | #112 | Exceptional 2.1% |
| Immigrants | Italy | 96.9 /100 | #113 | Exceptional 2.1% |
| Immigrants | Croatia | 96.8 /100 | #114 | Exceptional 2.1% |
Demographics Similar to Immigrants from Nicaragua by Doctorate Degree
In terms of doctorate degree, the demographic groups most similar to Immigrants from Nicaragua are Menominee (1.4%, a difference of 0.32%), Immigrants from Honduras (1.4%, a difference of 0.38%), Dominican (1.4%, a difference of 0.39%), Immigrants from the Azores (1.4%, a difference of 0.42%), and Immigrants from Jamaica (1.4%, a difference of 0.55%).
| Demographics | Rating | Rank | Doctorate Degree |
| Pennsylvania Germans | 0.1 /100 | #305 | Tragic 1.4% |
| Guyanese | 0.1 /100 | #306 | Tragic 1.4% |
| Cubans | 0.1 /100 | #307 | Tragic 1.4% |
| Immigrants | Laos | 0.1 /100 | #308 | Tragic 1.4% |
| Immigrants | Grenada | 0.1 /100 | #309 | Tragic 1.4% |
| Immigrants | Jamaica | 0.1 /100 | #310 | Tragic 1.4% |
| Immigrants | Honduras | 0.1 /100 | #311 | Tragic 1.4% |
| Immigrants | Nicaragua | 0.1 /100 | #312 | Tragic 1.4% |
| Menominee | 0.1 /100 | #313 | Tragic 1.4% |
| Dominicans | 0.1 /100 | #314 | Tragic 1.4% |
| Immigrants | Azores | 0.1 /100 | #315 | Tragic 1.4% |
| Navajo | 0.1 /100 | #316 | Tragic 1.4% |
| Immigrants | Micronesia | 0.1 /100 | #317 | Tragic 1.3% |
| Creek | 0.1 /100 | #318 | Tragic 1.3% |
| Immigrants | Guyana | 0.1 /100 | #319 | Tragic 1.3% |