European vs Immigrants from Latin America Associate's Degree
COMPARE
European
Immigrants from Latin America
Associate's Degree
Associate's Degree Comparison
Europeans
Immigrants from Latin America
48.2%
ASSOCIATE'S DEGREE
89.0/ 100
METRIC RATING
135th/ 347
METRIC RANK
37.9%
ASSOCIATE'S DEGREE
0.0/ 100
METRIC RATING
311th/ 347
METRIC RANK
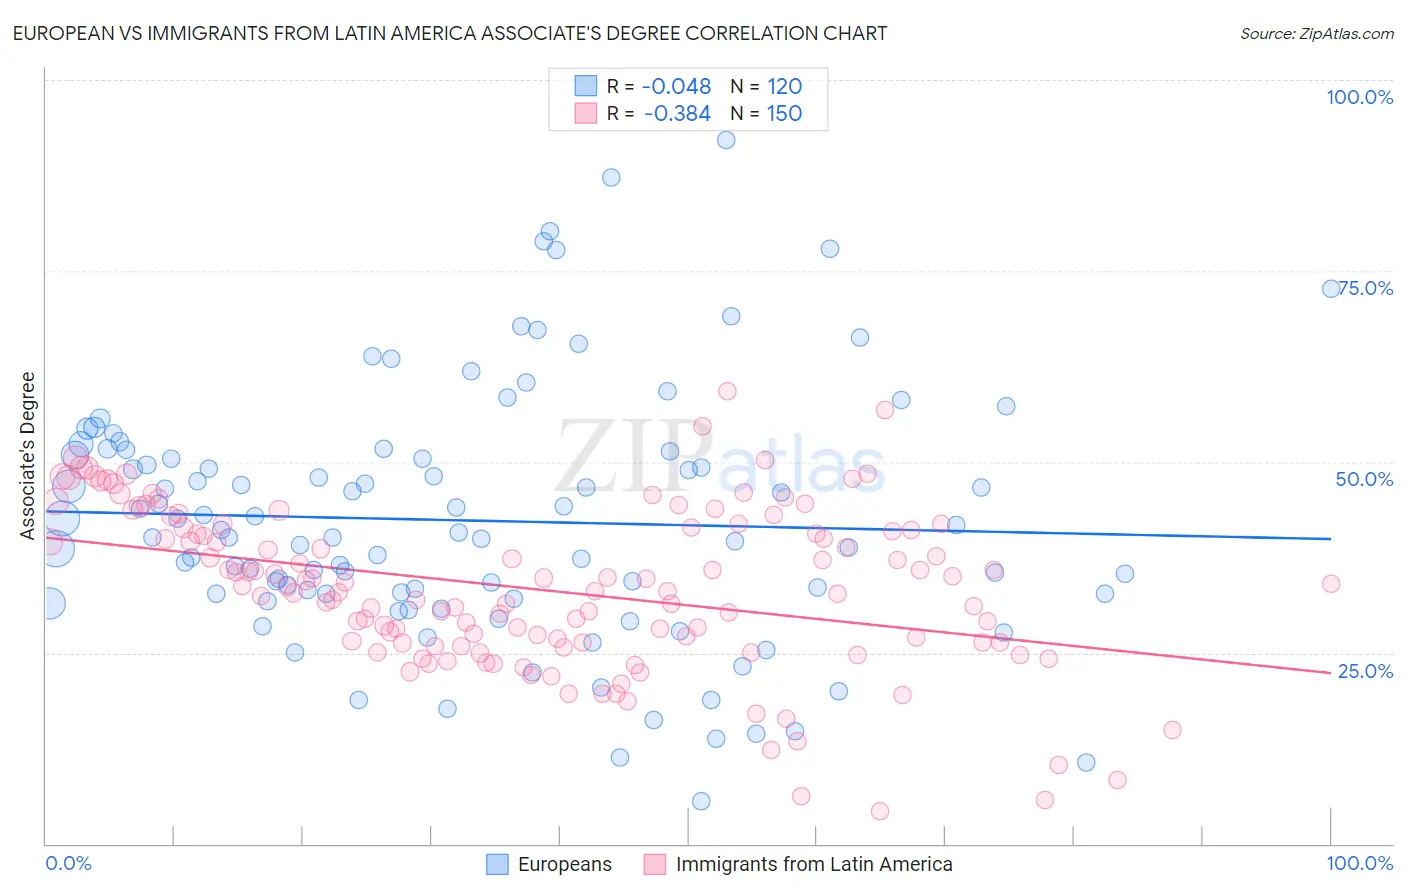
European vs Immigrants from Latin America Associate's Degree Correlation Chart
The statistical analysis conducted on geographies consisting of 561,753,260 people shows no correlation between the proportion of Europeans and percentage of population with at least associate's degree education in the United States with a correlation coefficient (R) of -0.048 and weighted average of 48.2%. Similarly, the statistical analysis conducted on geographies consisting of 558,543,762 people shows a mild negative correlation between the proportion of Immigrants from Latin America and percentage of population with at least associate's degree education in the United States with a correlation coefficient (R) of -0.384 and weighted average of 37.9%, a difference of 27.2%.
Associate's Degree Correlation Summary
| Measurement | European | Immigrants from Latin America |
| Minimum | 5.6% | 4.2% |
| Maximum | 92.2% | 59.3% |
| Range | 86.6% | 55.1% |
| Mean | 42.3% | 33.3% |
| Median | 40.4% | 33.4% |
| Interquartile 25% (IQ1) | 32.7% | 26.3% |
| Interquartile 75% (IQ3) | 51.2% | 41.3% |
| Interquartile Range (IQR) | 18.5% | 15.0% |
| Standard Deviation (Sample) | 16.5% | 10.6% |
| Standard Deviation (Population) | 16.4% | 10.6% |
Similar Demographics by Associate's Degree
Demographics Similar to Europeans by Associate's Degree
In terms of associate's degree, the demographic groups most similar to Europeans are Moroccan (48.2%, a difference of 0.060%), Assyrian/Chaldean/Syriac (48.2%, a difference of 0.080%), Immigrants from Albania (48.2%, a difference of 0.16%), Pakistani (48.1%, a difference of 0.18%), and Immigrants from Eritrea (48.1%, a difference of 0.22%).
| Demographics | Rating | Rank | Associate's Degree |
| Immigrants | Eastern Africa | 91.6 /100 | #128 | Exceptional 48.4% |
| Swedes | 91.5 /100 | #129 | Exceptional 48.4% |
| Immigrants | Jordan | 91.2 /100 | #130 | Exceptional 48.4% |
| Icelanders | 90.8 /100 | #131 | Exceptional 48.3% |
| Immigrants | Albania | 89.9 /100 | #132 | Excellent 48.2% |
| Assyrians/Chaldeans/Syriacs | 89.4 /100 | #133 | Excellent 48.2% |
| Moroccans | 89.3 /100 | #134 | Excellent 48.2% |
| Europeans | 89.0 /100 | #135 | Excellent 48.2% |
| Pakistanis | 88.0 /100 | #136 | Excellent 48.1% |
| Immigrants | Eritrea | 87.8 /100 | #137 | Excellent 48.1% |
| Poles | 87.3 /100 | #138 | Excellent 48.0% |
| Slovenes | 85.1 /100 | #139 | Excellent 47.9% |
| Immigrants | Southern Europe | 84.4 /100 | #140 | Excellent 47.8% |
| Taiwanese | 83.3 /100 | #141 | Excellent 47.7% |
| Sierra Leoneans | 82.9 /100 | #142 | Excellent 47.7% |
Demographics Similar to Immigrants from Latin America by Associate's Degree
In terms of associate's degree, the demographic groups most similar to Immigrants from Latin America are Immigrants from Dominican Republic (37.9%, a difference of 0.11%), Choctaw (37.8%, a difference of 0.22%), Hispanic or Latino (37.7%, a difference of 0.37%), Seminole (37.7%, a difference of 0.42%), and Immigrants from Guatemala (38.1%, a difference of 0.73%).
| Demographics | Rating | Rank | Associate's Degree |
| Sioux | 0.0 /100 | #304 | Tragic 38.5% |
| Immigrants | Honduras | 0.0 /100 | #305 | Tragic 38.5% |
| Shoshone | 0.0 /100 | #306 | Tragic 38.4% |
| Immigrants | El Salvador | 0.0 /100 | #307 | Tragic 38.4% |
| Mexican American Indians | 0.0 /100 | #308 | Tragic 38.2% |
| Immigrants | Guatemala | 0.0 /100 | #309 | Tragic 38.1% |
| Immigrants | Dominican Republic | 0.0 /100 | #310 | Tragic 37.9% |
| Immigrants | Latin America | 0.0 /100 | #311 | Tragic 37.9% |
| Choctaw | 0.0 /100 | #312 | Tragic 37.8% |
| Hispanics or Latinos | 0.0 /100 | #313 | Tragic 37.7% |
| Seminole | 0.0 /100 | #314 | Tragic 37.7% |
| Creek | 0.0 /100 | #315 | Tragic 37.6% |
| Crow | 0.0 /100 | #316 | Tragic 37.6% |
| Yaqui | 0.0 /100 | #317 | Tragic 37.6% |
| Alaska Natives | 0.0 /100 | #318 | Tragic 37.5% |