European vs Immigrants from Ireland Master's Degree

COMPARE

European
Race
Ancestry
AfghanAfricanAlaska NativeAlaskan AthabascanAlbanianAleutAlsatianAmericanApacheArabArapahoArgentineanArmenianAssyrian/Chaldean/SyriacAustralianAustrianBahamianBangladeshiBarbadianBasqueBelgianBelizeanBermudanBhutaneseBlackfeetBolivianBrazilianBritishBritish West IndianBulgarianBurmeseCajunCambodianCanadianCape VerdeanCarpatho RusynCelticCentral AmericanCentral American IndianCherokeeCheyenneChickasawChileanChineseChippewaChoctawColombianColvilleComancheCosta RicanCreeCreekCroatianCrowCubanCypriotCzechCzechoslovakianDanishDelawareDominicanDutchDutch West IndianEastern EuropeanEcuadorianEgyptianEnglishEstonianEthiopianEuropeanFijianFilipinoFinnishFrenchFrench American IndianFrench CanadianGermanGerman RussianGhanaianGreekGuamanian/ChamorroGuatemalanGuyaneseHaitianHmongHonduranHopiHoumaHungarianIcelanderIndian (Asian)IndonesianInupiatIranianIraqiIrishIroquoisIsraeliItalianJamaicanJapaneseJordanianKenyanKiowaKoreanLaotianLatvianLebaneseLiberianLithuanianLumbeeLuxembourgerMacedonianMalaysianMalteseMarshalleseMenomineeMexicanMexican American IndianMongolianMoroccanNative HawaiianNavajoNepaleseNew ZealanderNicaraguanNigerianNorthern EuropeanNorwegianOkinawanOsageOttawaPaiutePakistaniPalestinianPanamanianParaguayanPennsylvania GermanPeruvianPimaPolishPortuguesePotawatomiPuebloPuerto RicanPuget Sound SalishRomanianRussianSalvadoranSamoanScandinavianScotch-IrishScottishSeminoleSenegaleseSerbianShoshoneSierra LeoneanSiouxSlavicSlovakSloveneSomaliSouth AfricanSouth AmericanSouth American IndianSoviet UnionSpaniardSpanishSpanish AmericanSpanish American IndianSri LankanSubsaharan AfricanSudaneseSwedishSwissSyrianTaiwaneseThaiTlingit-HaidaTohono O'OdhamTonganTrinidadian and TobagonianTsimshianTurkishU.S. Virgin IslanderUgandanUkrainianUruguayanUteVenezuelanVietnameseWelshWest IndianYakamaYaquiYugoslavianYumanYup'ikZimbabwean
Immigration
NonimmigrantsImmigrantsAfghanistanAfricaAlbaniaArgentinaArmeniaAsiaAustraliaAustriaBahamasBangladeshBarbadosBelarusBelgiumBelizeBoliviaBosnia and HerzegovinaBrazilBulgariaBurma/MyanmarCabo VerdeCambodiaCameroonCanadaCaribbeanCentral AmericaChileChinaColombiaCongoCosta RicaCroatiaCubaCzechoslovakiaDenmarkDominicaDominican RepublicEastern AfricaEastern AsiaEastern EuropeEcuadorEgyptEl SalvadorEnglandEritreaEthiopiaEuropeFijiFranceGermanyGhanaGreeceGrenadaGuatemalaGuyanaHaitiHondurasHong KongHungaryIndiaIndonesiaIranIraqIsraelItalyJamaicaJapanJordanKazakhstanKenyaKoreaKuwaitLaosLatin AmericaLatviaLebanonLiberiaLithuaniaMalaysiaMexicoMicronesiaMiddle AfricaMoldovaMoroccoNepalNetherlandsNicaraguaNigeriaNorth AmericaNorth MacedoniaNorthern AfricaNorthern EuropeNorwayOceaniaPakistanPanamaPeruPhilippinesPolandPortugalRomaniaRussiaSaudi ArabiaScotlandSenegalSerbiaSierra LeoneSingaporeSomaliaSouth AfricaSouth AmericaSouth Central AsiaSouth Eastern AsiaSouthern EuropeSpainSri LankaSt. Vincent and the GrenadinesSudanSwedenSwitzerlandSyriaTaiwanThailandTrinidad and TobagoTurkeyUgandaUkraineUruguayUzbekistanVenezuelaVietnamWest IndiesWestern AfricaWestern AsiaWestern EuropeYemenZaireZimbabweAzores
Immigrants from Ireland
Race
Ancestry
AfghanAfricanAlaska NativeAlaskan AthabascanAlbanianAleutAlsatianAmericanApacheArabArapahoArgentineanArmenianAssyrian/Chaldean/SyriacAustralianAustrianBahamianBangladeshiBarbadianBasqueBelgianBelizeanBermudanBhutaneseBlackfeetBolivianBrazilianBritishBritish West IndianBulgarianBurmeseCajunCambodianCanadianCape VerdeanCarpatho RusynCelticCentral AmericanCentral American IndianCherokeeCheyenneChickasawChileanChineseChippewaChoctawColombianColvilleComancheCosta RicanCreeCreekCroatianCrowCubanCypriotCzechCzechoslovakianDanishDelawareDominicanDutchDutch West IndianEastern EuropeanEcuadorianEgyptianEnglishEstonianEthiopianFijianFilipinoFinnishFrenchFrench American IndianFrench CanadianGermanGerman RussianGhanaianGreekGuamanian/ChamorroGuatemalanGuyaneseHaitianHmongHonduranHopiHoumaHungarianIcelanderIndian (Asian)IndonesianInupiatIranianIraqiIrishIroquoisIsraeliItalianJamaicanJapaneseJordanianKenyanKiowaKoreanLaotianLatvianLebaneseLiberianLithuanianLumbeeLuxembourgerMacedonianMalaysianMalteseMarshalleseMenomineeMexicanMexican American IndianMongolianMoroccanNative HawaiianNavajoNepaleseNew ZealanderNicaraguanNigerianNorthern EuropeanNorwegianOkinawanOsageOttawaPaiutePakistaniPalestinianPanamanianParaguayanPennsylvania GermanPeruvianPimaPolishPortuguesePotawatomiPuebloPuerto RicanPuget Sound SalishRomanianRussianSalvadoranSamoanScandinavianScotch-IrishScottishSeminoleSenegaleseSerbianShoshoneSierra LeoneanSiouxSlavicSlovakSloveneSomaliSouth AfricanSouth AmericanSouth American IndianSoviet UnionSpaniardSpanishSpanish AmericanSpanish American IndianSri LankanSubsaharan AfricanSudaneseSwedishSwissSyrianTaiwaneseThaiTlingit-HaidaTohono O'OdhamTonganTrinidadian and TobagonianTsimshianTurkishU.S. Virgin IslanderUgandanUkrainianUruguayanUteVenezuelanVietnameseWelshWest IndianYakamaYaquiYugoslavianYumanYup'ikZimbabwean
Immigration
NonimmigrantsImmigrantsAfghanistanAfricaAlbaniaArgentinaArmeniaAsiaAustraliaAustriaBahamasBangladeshBarbadosBelarusBelgiumBelizeBoliviaBosnia and HerzegovinaBrazilBulgariaBurma/MyanmarCabo VerdeCambodiaCameroonCanadaCaribbeanCentral AmericaChileChinaColombiaCongoCosta RicaCroatiaCubaCzechoslovakiaDenmarkDominicaDominican RepublicEastern AfricaEastern AsiaEastern EuropeEcuadorEgyptEl SalvadorEnglandEritreaEthiopiaEuropeFijiFranceGermanyGhanaGreeceGrenadaGuatemalaGuyanaHaitiHondurasHong KongHungaryIndiaIndonesiaIranIraqIrelandIsraelItalyJamaicaJapanJordanKazakhstanKenyaKoreaKuwaitLaosLatin AmericaLatviaLebanonLiberiaLithuaniaMalaysiaMexicoMicronesiaMiddle AfricaMoldovaMoroccoNepalNetherlandsNicaraguaNigeriaNorth AmericaNorth MacedoniaNorthern AfricaNorthern EuropeNorwayOceaniaPakistanPanamaPeruPhilippinesPolandPortugalRomaniaRussiaSaudi ArabiaScotlandSenegalSerbiaSierra LeoneSingaporeSomaliaSouth AfricaSouth AmericaSouth Central AsiaSouth Eastern AsiaSouthern EuropeSpainSri LankaSt. Vincent and the GrenadinesSudanSwedenSwitzerlandSyriaTaiwanThailandTrinidad and TobagoTurkeyUgandaUkraineUruguayUzbekistanVenezuelaVietnamWest IndiesWestern AfricaWestern AsiaWestern EuropeYemenZaireZimbabweAzores
Master's Degree
Income
Poverty
Unemployment
Labor Participation
Family Structure
Vehicle Availability
Education Level
Disability

Master's Degree Comparison

Europeans

Immigrants from Ireland

Excellent
Exceptional
15.8%
MASTER'S DEGREE
86.4/ 100
METRIC RATING
137th/ 347
METRIC RANK
20.4%
MASTER'S DEGREE
100.0/ 100
METRIC RATING
21st/ 347
METRIC RANK

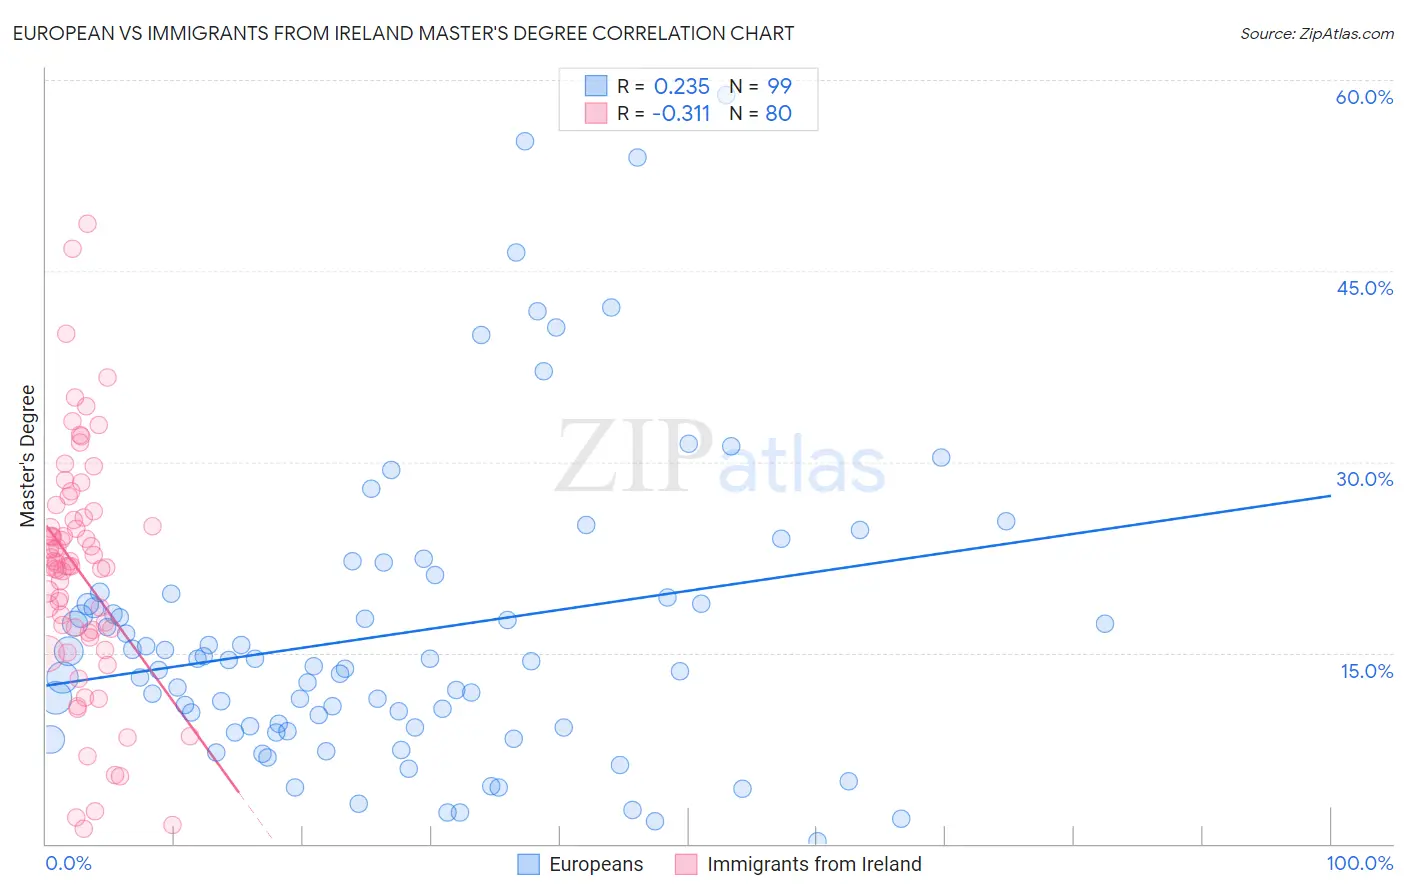
European vs Immigrants from Ireland Master's Degree Correlation Chart

The statistical analysis conducted on geographies consisting of 561,170,396 people shows a weak positive correlation between the proportion of Europeans and percentage of population with at least master's degree education in the United States with a correlation coefficient (R) of 0.235 and weighted average of 15.8%. Similarly, the statistical analysis conducted on geographies consisting of 240,764,624 people shows a mild negative correlation between the proportion of Immigrants from Ireland and percentage of population with at least master's degree education in the United States with a correlation coefficient (R) of -0.311 and weighted average of 20.4%, a difference of 29.3%.
European vs Immigrants from Ireland Master's Degree

Master's Degree Correlation Summary

MeasurementEuropeanImmigrants from Ireland
Minimum0.22%1.1%
Maximum58.8%48.7%
Range58.6%47.6%
Mean16.5%21.3%
Median13.9%21.8%
Interquartile 25% (IQ1)9.1%16.7%
Interquartile 75% (IQ3)19.4%25.5%
Interquartile Range (IQR)10.3%8.8%
Standard Deviation (Sample)11.8%9.3%
Standard Deviation (Population)11.8%9.3%

Similar Demographics by Master's Degree

Demographics Similar to Europeans by Master's Degree

In terms of master's degree, the demographic groups most similar to Europeans are Pakistani (15.8%, a difference of 0.080%), Assyrian/Chaldean/Syriac (15.8%, a difference of 0.10%), Immigrants from Germany (15.8%, a difference of 0.14%), Vietnamese (15.8%, a difference of 0.22%), and Polish (15.7%, a difference of 0.35%).
DemographicsRating | RankMaster's Degree
Immigrants | Jordan
92.7
/100
|
#130
Exceptional
16.1%
Taiwanese
91.9
/100
|
#131
Exceptional
16.1%
Serbians
91.7
/100
|
#132
Exceptional
16.1%
Immigrants | Sudan
90.2
/100
|
#133
Exceptional
16.0%
Venezuelans
88.4
/100
|
#134
Excellent
15.9%
South American Indians
88.4
/100
|
#135
Excellent
15.9%
Assyrians/Chaldeans/Syriacs
86.8
/100
|
#136
Excellent
15.8%
Europeans
86.4
/100
|
#137
Excellent
15.8%
Pakistanis
86.1
/100
|
#138
Excellent
15.8%
Immigrants | Germany
85.9
/100
|
#139
Excellent
15.8%
Vietnamese
85.5
/100
|
#140
Excellent
15.8%
Poles
85.0
/100
|
#141
Excellent
15.7%
Immigrants | Africa
84.0
/100
|
#142
Excellent
15.7%
Immigrants | Venezuela
83.6
/100
|
#143
Excellent
15.7%
Canadians
83.3
/100
|
#144
Excellent
15.7%

Demographics Similar to Immigrants from Ireland by Master's Degree

In terms of master's degree, the demographic groups most similar to Immigrants from Ireland are Indian (Asian) (20.5%, a difference of 0.11%), Immigrants from Hong Kong (20.5%, a difference of 0.13%), Israeli (20.3%, a difference of 0.42%), Soviet Union (20.5%, a difference of 0.48%), and Immigrants from France (20.3%, a difference of 0.70%).
DemographicsRating | RankMaster's Degree
Immigrants | Switzerland
100.0
/100
|
#14
Exceptional
20.9%
Immigrants | Eastern Asia
100.0
/100
|
#15
Exceptional
20.8%
Immigrants | Belgium
100.0
/100
|
#16
Exceptional
20.8%
Immigrants | South Central Asia
100.0
/100
|
#17
Exceptional
20.7%
Soviet Union
100.0
/100
|
#18
Exceptional
20.5%
Immigrants | Hong Kong
100.0
/100
|
#19
Exceptional
20.5%
Indians (Asian)
100.0
/100
|
#20
Exceptional
20.5%
Immigrants | Ireland
100.0
/100
|
#21
Exceptional
20.4%
Israelis
100.0
/100
|
#22
Exceptional
20.3%
Immigrants | France
100.0
/100
|
#23
Exceptional
20.3%
Immigrants | Sweden
100.0
/100
|
#24
Exceptional
20.3%
Immigrants | Japan
100.0
/100
|
#25
Exceptional
20.0%
Cambodians
100.0
/100
|
#26
Exceptional
20.0%
Immigrants | Sri Lanka
100.0
/100
|
#27
Exceptional
19.9%
Turks
100.0
/100
|
#28
Exceptional
19.9%