Estonian vs Belizean 9th Grade
COMPARE
Estonian
Belizean
9th Grade
9th Grade Comparison
Estonians
Belizeans
96.1%
9TH GRADE
99.9/ 100
METRIC RATING
37th/ 347
METRIC RANK
91.8%
9TH GRADE
0.0/ 100
METRIC RATING
322nd/ 347
METRIC RANK
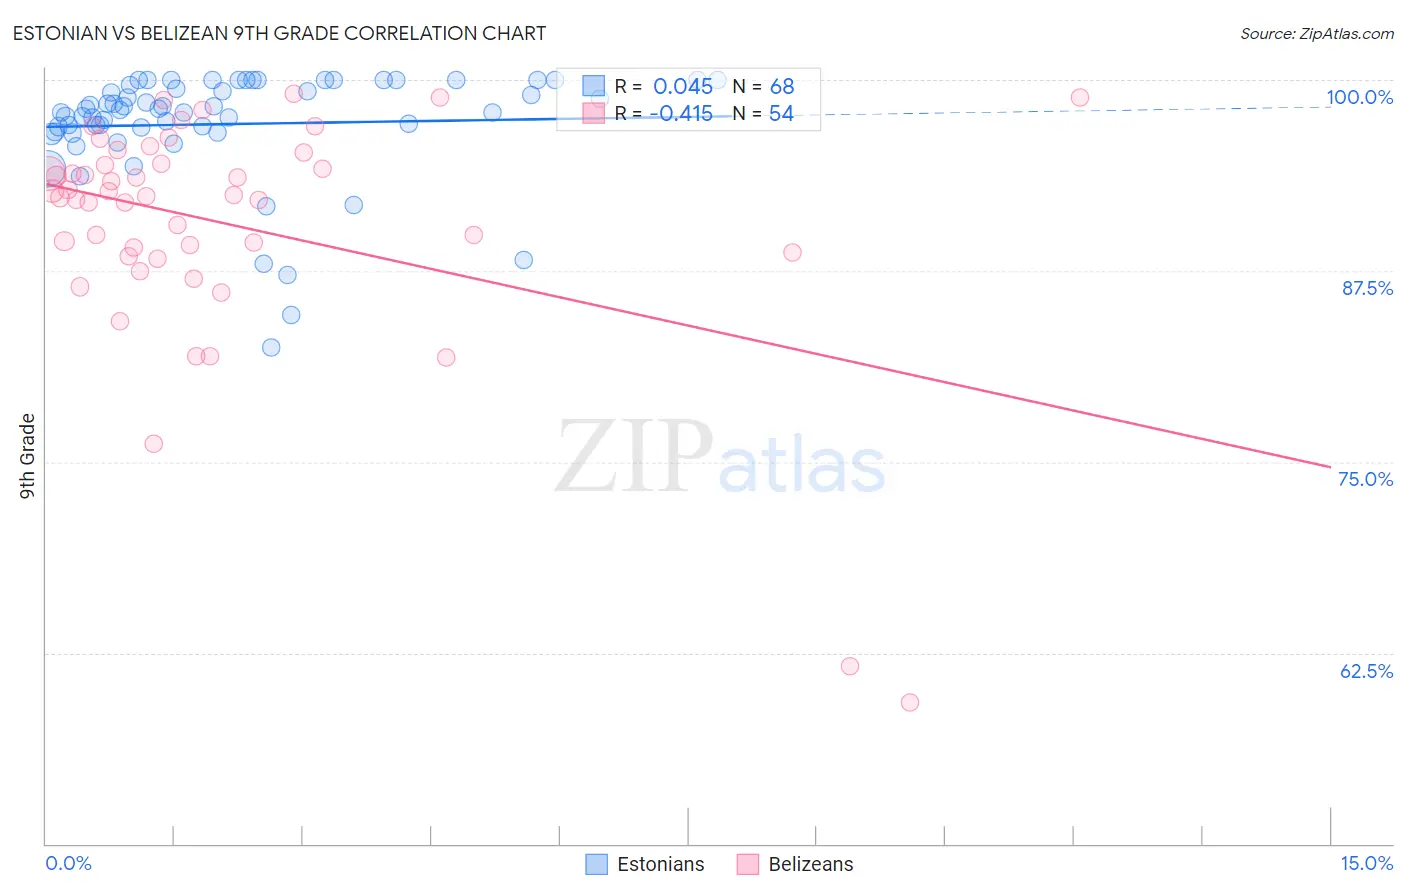
Estonian vs Belizean 9th Grade Correlation Chart
The statistical analysis conducted on geographies consisting of 123,528,404 people shows no correlation between the proportion of Estonians and percentage of population with at least 9th grade education in the United States with a correlation coefficient (R) of 0.045 and weighted average of 96.1%. Similarly, the statistical analysis conducted on geographies consisting of 144,225,006 people shows a moderate negative correlation between the proportion of Belizeans and percentage of population with at least 9th grade education in the United States with a correlation coefficient (R) of -0.415 and weighted average of 91.8%, a difference of 4.7%.
9th Grade Correlation Summary
| Measurement | Estonian | Belizean |
| Minimum | 82.5% | 59.3% |
| Maximum | 100.0% | 99.1% |
| Range | 17.5% | 39.8% |
| Mean | 97.1% | 90.6% |
| Median | 98.1% | 92.4% |
| Interquartile 25% (IQ1) | 96.7% | 88.7% |
| Interquartile 75% (IQ3) | 99.8% | 94.5% |
| Interquartile Range (IQR) | 3.1% | 5.9% |
| Standard Deviation (Sample) | 3.7% | 7.7% |
| Standard Deviation (Population) | 3.7% | 7.6% |
Similar Demographics by 9th Grade
Demographics Similar to Estonians by 9th Grade
In terms of 9th grade, the demographic groups most similar to Estonians are Immigrants from Scotland (96.1%, a difference of 0.0%), Ottawa (96.1%, a difference of 0.020%), Northern European (96.2%, a difference of 0.040%), Slavic (96.1%, a difference of 0.040%), and Bulgarian (96.2%, a difference of 0.050%).
| Demographics | Rating | Rank | 9th Grade |
| Maltese | 100.0 /100 | #30 | Exceptional 96.3% |
| British | 100.0 /100 | #31 | Exceptional 96.3% |
| Belgians | 100.0 /100 | #32 | Exceptional 96.3% |
| Luxembourgers | 100.0 /100 | #33 | Exceptional 96.3% |
| Hungarians | 100.0 /100 | #34 | Exceptional 96.2% |
| Bulgarians | 99.9 /100 | #35 | Exceptional 96.2% |
| Northern Europeans | 99.9 /100 | #36 | Exceptional 96.2% |
| Estonians | 99.9 /100 | #37 | Exceptional 96.1% |
| Immigrants | Scotland | 99.9 /100 | #38 | Exceptional 96.1% |
| Ottawa | 99.9 /100 | #39 | Exceptional 96.1% |
| Slavs | 99.9 /100 | #40 | Exceptional 96.1% |
| Czechoslovakians | 99.9 /100 | #41 | Exceptional 96.1% |
| Chippewa | 99.9 /100 | #42 | Exceptional 96.1% |
| Iranians | 99.9 /100 | #43 | Exceptional 96.1% |
| Alaska Natives | 99.9 /100 | #44 | Exceptional 96.1% |
Demographics Similar to Belizeans by 9th Grade
In terms of 9th grade, the demographic groups most similar to Belizeans are Puerto Rican (91.8%, a difference of 0.0%), Immigrants from Ecuador (91.8%, a difference of 0.030%), Immigrants from Belize (91.8%, a difference of 0.060%), Nicaraguan (91.9%, a difference of 0.090%), and Ecuadorian (91.9%, a difference of 0.13%).
| Demographics | Rating | Rank | 9th Grade |
| Immigrants | Caribbean | 0.0 /100 | #315 | Tragic 92.2% |
| Cape Verdeans | 0.0 /100 | #316 | Tragic 92.2% |
| Immigrants | Cuba | 0.0 /100 | #317 | Tragic 92.2% |
| Nepalese | 0.0 /100 | #318 | Tragic 92.0% |
| Ecuadorians | 0.0 /100 | #319 | Tragic 91.9% |
| Nicaraguans | 0.0 /100 | #320 | Tragic 91.9% |
| Immigrants | Ecuador | 0.0 /100 | #321 | Tragic 91.8% |
| Belizeans | 0.0 /100 | #322 | Tragic 91.8% |
| Puerto Ricans | 0.0 /100 | #323 | Tragic 91.8% |
| Immigrants | Belize | 0.0 /100 | #324 | Tragic 91.8% |
| Central American Indians | 0.0 /100 | #325 | Tragic 91.5% |
| Immigrants | Armenia | 0.0 /100 | #326 | Tragic 91.4% |
| Immigrants | Nicaragua | 0.0 /100 | #327 | Tragic 91.3% |
| Dominicans | 0.0 /100 | #328 | Tragic 91.1% |
| Hondurans | 0.0 /100 | #329 | Tragic 91.0% |