Egyptian vs Swiss Doctorate Degree
COMPARE
Egyptian
Swiss
Doctorate Degree
Doctorate Degree Comparison
Egyptians
Swiss
2.2%
DOCTORATE DEGREE
99.4/ 100
METRIC RATING
86th/ 347
METRIC RANK
2.0%
DOCTORATE DEGREE
88.0/ 100
METRIC RATING
138th/ 347
METRIC RANK
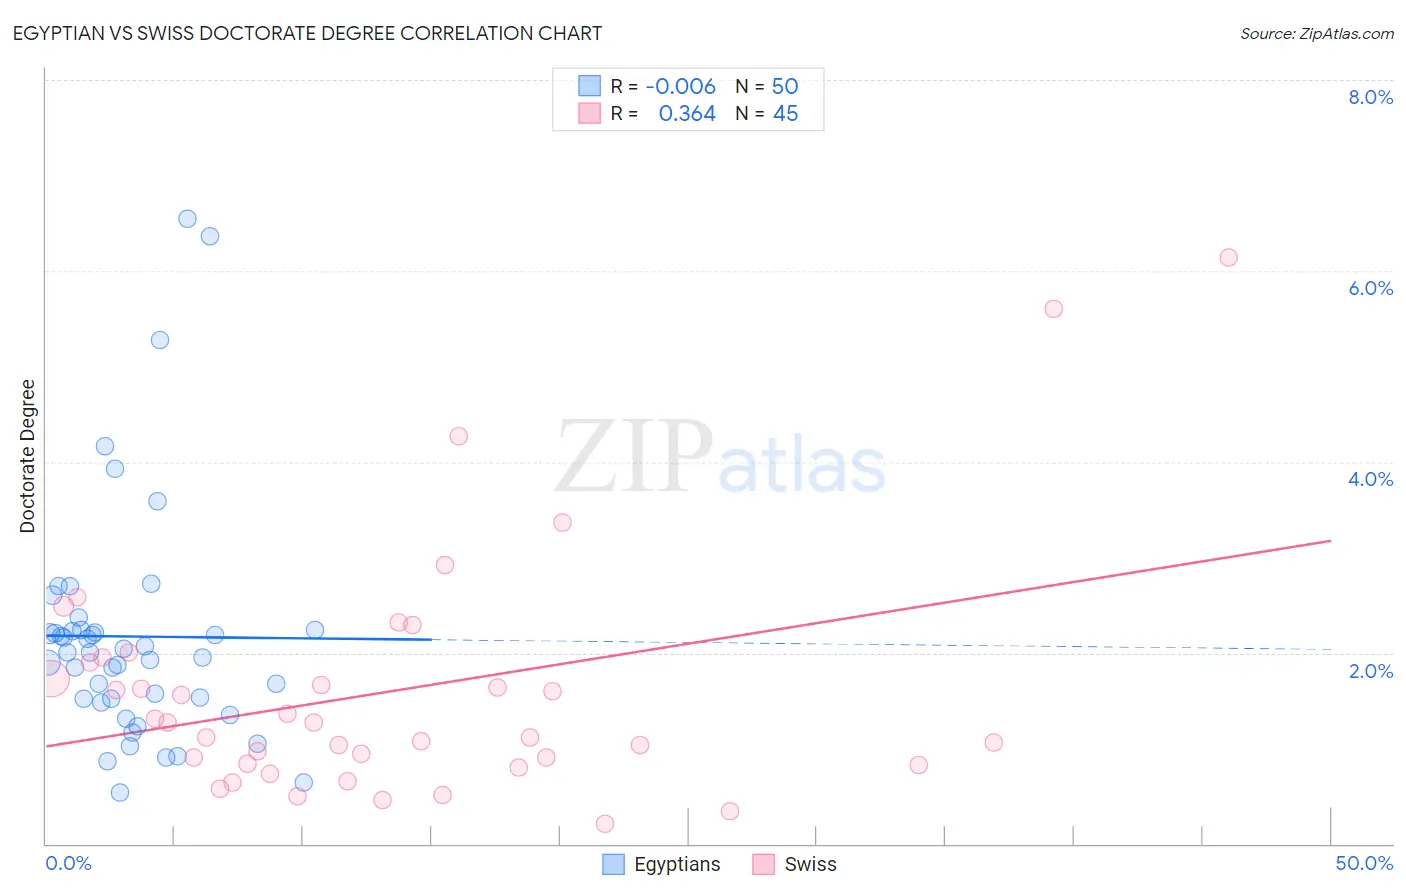
Egyptian vs Swiss Doctorate Degree Correlation Chart
The statistical analysis conducted on geographies consisting of 275,731,799 people shows no correlation between the proportion of Egyptians and percentage of population with at least doctorate degree education in the United States with a correlation coefficient (R) of -0.006 and weighted average of 2.2%. Similarly, the statistical analysis conducted on geographies consisting of 455,851,671 people shows a mild positive correlation between the proportion of Swiss and percentage of population with at least doctorate degree education in the United States with a correlation coefficient (R) of 0.364 and weighted average of 2.0%, a difference of 10.9%.
Doctorate Degree Correlation Summary
| Measurement | Egyptian | Swiss |
| Minimum | 0.53% | 0.21% |
| Maximum | 6.5% | 6.1% |
| Range | 6.0% | 5.9% |
| Mean | 2.2% | 1.6% |
| Median | 2.0% | 1.3% |
| Interquartile 25% (IQ1) | 1.5% | 0.84% |
| Interquartile 75% (IQ3) | 2.2% | 1.9% |
| Interquartile Range (IQR) | 0.72% | 1.1% |
| Standard Deviation (Sample) | 1.2% | 1.2% |
| Standard Deviation (Population) | 1.2% | 1.2% |
Similar Demographics by Doctorate Degree
Demographics Similar to Egyptians by Doctorate Degree
In terms of doctorate degree, the demographic groups most similar to Egyptians are Immigrants from Zimbabwe (2.2%, a difference of 0.11%), Immigrants from Nepal (2.2%, a difference of 0.47%), Immigrants from Brazil (2.2%, a difference of 0.70%), Immigrants from England (2.2%, a difference of 0.83%), and British (2.2%, a difference of 0.91%).
| Demographics | Rating | Rank | Doctorate Degree |
| Northern Europeans | 99.7 /100 | #79 | Exceptional 2.2% |
| Ugandans | 99.7 /100 | #80 | Exceptional 2.2% |
| Immigrants | Argentina | 99.7 /100 | #81 | Exceptional 2.2% |
| Immigrants | Uganda | 99.6 /100 | #82 | Exceptional 2.2% |
| Immigrants | Lithuania | 99.6 /100 | #83 | Exceptional 2.2% |
| Immigrants | England | 99.6 /100 | #84 | Exceptional 2.2% |
| Immigrants | Brazil | 99.6 /100 | #85 | Exceptional 2.2% |
| Egyptians | 99.4 /100 | #86 | Exceptional 2.2% |
| Immigrants | Zimbabwe | 99.4 /100 | #87 | Exceptional 2.2% |
| Immigrants | Nepal | 99.3 /100 | #88 | Exceptional 2.2% |
| British | 99.3 /100 | #89 | Exceptional 2.2% |
| Immigrants | Scotland | 99.2 /100 | #90 | Exceptional 2.2% |
| Immigrants | Sudan | 99.1 /100 | #91 | Exceptional 2.2% |
| Chileans | 99.1 /100 | #92 | Exceptional 2.2% |
| Alsatians | 99.0 /100 | #93 | Exceptional 2.1% |
Demographics Similar to Swiss by Doctorate Degree
In terms of doctorate degree, the demographic groups most similar to Swiss are South American Indian (2.0%, a difference of 0.090%), Swedish (2.0%, a difference of 0.10%), Afghan (2.0%, a difference of 0.23%), Serbian (2.0%, a difference of 0.24%), and Immigrants from Cameroon (2.0%, a difference of 0.30%).
| Demographics | Rating | Rank | Doctorate Degree |
| Immigrants | Sierra Leone | 90.2 /100 | #131 | Exceptional 2.0% |
| Scottish | 89.4 /100 | #132 | Excellent 2.0% |
| Immigrants | Uzbekistan | 89.3 /100 | #133 | Excellent 2.0% |
| Immigrants | Cameroon | 88.9 /100 | #134 | Excellent 2.0% |
| Serbians | 88.7 /100 | #135 | Excellent 2.0% |
| Swedes | 88.3 /100 | #136 | Excellent 2.0% |
| South American Indians | 88.3 /100 | #137 | Excellent 2.0% |
| Swiss | 88.0 /100 | #138 | Excellent 2.0% |
| Afghans | 87.2 /100 | #139 | Excellent 2.0% |
| Immigrants | Africa | 87.0 /100 | #140 | Excellent 2.0% |
| Senegalese | 86.7 /100 | #141 | Excellent 2.0% |
| Italians | 86.0 /100 | #142 | Excellent 2.0% |
| Sierra Leoneans | 85.1 /100 | #143 | Excellent 2.0% |
| Immigrants | Moldova | 84.3 /100 | #144 | Excellent 2.0% |
| Kenyans | 83.6 /100 | #145 | Excellent 1.9% |