Egyptian vs Russian No Schooling Completed

COMPARE

Egyptian
Race
Ancestry
AfghanAfricanAlaska NativeAlaskan AthabascanAlbanianAleutAlsatianAmericanApacheArabArapahoArgentineanArmenianAssyrian/Chaldean/SyriacAustralianAustrianBahamianBangladeshiBarbadianBasqueBelgianBelizeanBermudanBhutaneseBlackfeetBolivianBrazilianBritishBritish West IndianBulgarianBurmeseCajunCambodianCanadianCape VerdeanCarpatho RusynCelticCentral AmericanCentral American IndianCherokeeCheyenneChickasawChileanChineseChippewaChoctawColombianColvilleComancheCosta RicanCreeCreekCroatianCrowCubanCypriotCzechCzechoslovakianDanishDelawareDominicanDutchDutch West IndianEastern EuropeanEcuadorianEgyptianEnglishEstonianEthiopianEuropeanFijianFilipinoFinnishFrenchFrench American IndianFrench CanadianGermanGerman RussianGhanaianGreekGuamanian/ChamorroGuatemalanGuyaneseHaitianHmongHonduranHopiHoumaHungarianIcelanderIndian (Asian)IndonesianInupiatIranianIraqiIrishIroquoisIsraeliItalianJamaicanJapaneseJordanianKenyanKiowaKoreanLaotianLatvianLebaneseLiberianLithuanianLumbeeLuxembourgerMacedonianMalaysianMalteseMarshalleseMenomineeMexicanMexican American IndianMongolianMoroccanNative HawaiianNavajoNepaleseNew ZealanderNicaraguanNigerianNorthern EuropeanNorwegianOkinawanOsageOttawaPaiutePakistaniPalestinianPanamanianParaguayanPennsylvania GermanPeruvianPimaPolishPortuguesePotawatomiPuebloPuerto RicanPuget Sound SalishRomanianSalvadoranSamoanScandinavianScotch-IrishScottishSeminoleSenegaleseSerbianShoshoneSierra LeoneanSiouxSlavicSlovakSloveneSomaliSouth AfricanSouth AmericanSouth American IndianSoviet UnionSpaniardSpanishSpanish AmericanSpanish American IndianSri LankanSubsaharan AfricanSudaneseSwedishSwissSyrianTaiwaneseThaiTlingit-HaidaTohono O'OdhamTonganTrinidadian and TobagonianTsimshianTurkishU.S. Virgin IslanderUgandanUkrainianUruguayanUteVenezuelanVietnameseWelshWest IndianYakamaYaquiYugoslavianYumanYup'ikZimbabwean
Immigration
NonimmigrantsImmigrantsAfghanistanAfricaAlbaniaArgentinaArmeniaAsiaAustraliaAustriaBahamasBangladeshBarbadosBelarusBelgiumBelizeBoliviaBosnia and HerzegovinaBrazilBulgariaBurma/MyanmarCabo VerdeCambodiaCameroonCanadaCaribbeanCentral AmericaChileChinaColombiaCongoCosta RicaCroatiaCubaCzechoslovakiaDenmarkDominicaDominican RepublicEastern AfricaEastern AsiaEastern EuropeEcuadorEgyptEl SalvadorEnglandEritreaEthiopiaEuropeFijiFranceGermanyGhanaGreeceGrenadaGuatemalaGuyanaHaitiHondurasHong KongHungaryIndiaIndonesiaIranIraqIrelandIsraelItalyJamaicaJapanJordanKazakhstanKenyaKoreaKuwaitLaosLatin AmericaLatviaLebanonLiberiaLithuaniaMalaysiaMexicoMicronesiaMiddle AfricaMoldovaMoroccoNepalNetherlandsNicaraguaNigeriaNorth AmericaNorth MacedoniaNorthern AfricaNorthern EuropeNorwayOceaniaPakistanPanamaPeruPhilippinesPolandPortugalRomaniaRussiaSaudi ArabiaScotlandSenegalSerbiaSierra LeoneSingaporeSomaliaSouth AfricaSouth AmericaSouth Central AsiaSouth Eastern AsiaSouthern EuropeSpainSri LankaSt. Vincent and the GrenadinesSudanSwedenSwitzerlandSyriaTaiwanThailandTrinidad and TobagoTurkeyUgandaUkraineUruguayUzbekistanVenezuelaVietnamWest IndiesWestern AfricaWestern AsiaWestern EuropeYemenZaireZimbabweAzores
Russian
Race
Ancestry
AfghanAfricanAlaska NativeAlaskan AthabascanAlbanianAleutAlsatianAmericanApacheArabArapahoArgentineanArmenianAssyrian/Chaldean/SyriacAustralianAustrianBahamianBangladeshiBarbadianBasqueBelgianBelizeanBermudanBhutaneseBlackfeetBolivianBrazilianBritishBritish West IndianBulgarianBurmeseCajunCambodianCanadianCape VerdeanCarpatho RusynCelticCentral AmericanCentral American IndianCherokeeCheyenneChickasawChileanChineseChippewaChoctawColombianColvilleComancheCosta RicanCreeCreekCroatianCrowCubanCypriotCzechCzechoslovakianDanishDelawareDominicanDutchDutch West IndianEastern EuropeanEcuadorianEnglishEstonianEthiopianEuropeanFijianFilipinoFinnishFrenchFrench American IndianFrench CanadianGermanGerman RussianGhanaianGreekGuamanian/ChamorroGuatemalanGuyaneseHaitianHmongHonduranHopiHoumaHungarianIcelanderIndian (Asian)IndonesianInupiatIranianIraqiIrishIroquoisIsraeliItalianJamaicanJapaneseJordanianKenyanKiowaKoreanLaotianLatvianLebaneseLiberianLithuanianLumbeeLuxembourgerMacedonianMalaysianMalteseMarshalleseMenomineeMexicanMexican American IndianMongolianMoroccanNative HawaiianNavajoNepaleseNew ZealanderNicaraguanNigerianNorthern EuropeanNorwegianOkinawanOsageOttawaPaiutePakistaniPalestinianPanamanianParaguayanPennsylvania GermanPeruvianPimaPolishPortuguesePotawatomiPuebloPuerto RicanPuget Sound SalishRomanianRussianSalvadoranSamoanScandinavianScotch-IrishScottishSeminoleSenegaleseSerbianShoshoneSierra LeoneanSiouxSlavicSlovakSloveneSomaliSouth AfricanSouth AmericanSouth American IndianSoviet UnionSpaniardSpanishSpanish AmericanSpanish American IndianSri LankanSubsaharan AfricanSudaneseSwedishSwissSyrianTaiwaneseThaiTlingit-HaidaTohono O'OdhamTonganTrinidadian and TobagonianTsimshianTurkishU.S. Virgin IslanderUgandanUkrainianUruguayanUteVenezuelanVietnameseWelshWest IndianYakamaYaquiYugoslavianYumanYup'ikZimbabwean
Immigration
NonimmigrantsImmigrantsAfghanistanAfricaAlbaniaArgentinaArmeniaAsiaAustraliaAustriaBahamasBangladeshBarbadosBelarusBelgiumBelizeBoliviaBosnia and HerzegovinaBrazilBulgariaBurma/MyanmarCabo VerdeCambodiaCameroonCanadaCaribbeanCentral AmericaChileChinaColombiaCongoCosta RicaCroatiaCubaCzechoslovakiaDenmarkDominicaDominican RepublicEastern AfricaEastern AsiaEastern EuropeEcuadorEgyptEl SalvadorEnglandEritreaEthiopiaEuropeFijiFranceGermanyGhanaGreeceGrenadaGuatemalaGuyanaHaitiHondurasHong KongHungaryIndiaIndonesiaIranIraqIrelandIsraelItalyJamaicaJapanJordanKazakhstanKenyaKoreaKuwaitLaosLatin AmericaLatviaLebanonLiberiaLithuaniaMalaysiaMexicoMicronesiaMiddle AfricaMoldovaMoroccoNepalNetherlandsNicaraguaNigeriaNorth AmericaNorth MacedoniaNorthern AfricaNorthern EuropeNorwayOceaniaPakistanPanamaPeruPhilippinesPolandPortugalRomaniaRussiaSaudi ArabiaScotlandSenegalSerbiaSierra LeoneSingaporeSomaliaSouth AfricaSouth AmericaSouth Central AsiaSouth Eastern AsiaSouthern EuropeSpainSri LankaSt. Vincent and the GrenadinesSudanSwedenSwitzerlandSyriaTaiwanThailandTrinidad and TobagoTurkeyUgandaUkraineUruguayUzbekistanVenezuelaVietnamWest IndiesWestern AfricaWestern AsiaWestern EuropeYemenZaireZimbabweAzores
No Schooling Completed
Income
Poverty
Unemployment
Labor Participation
Family Structure
Vehicle Availability
Education Level
Disability

No Schooling Completed Comparison

Egyptians

Russians

Average
Exceptional
2.1%
NO SCHOOLING COMPLETED
59.2/ 100
METRIC RATING
167th/ 347
METRIC RANK
1.7%
NO SCHOOLING COMPLETED
99.8/ 100
METRIC RATING
63rd/ 347
METRIC RANK

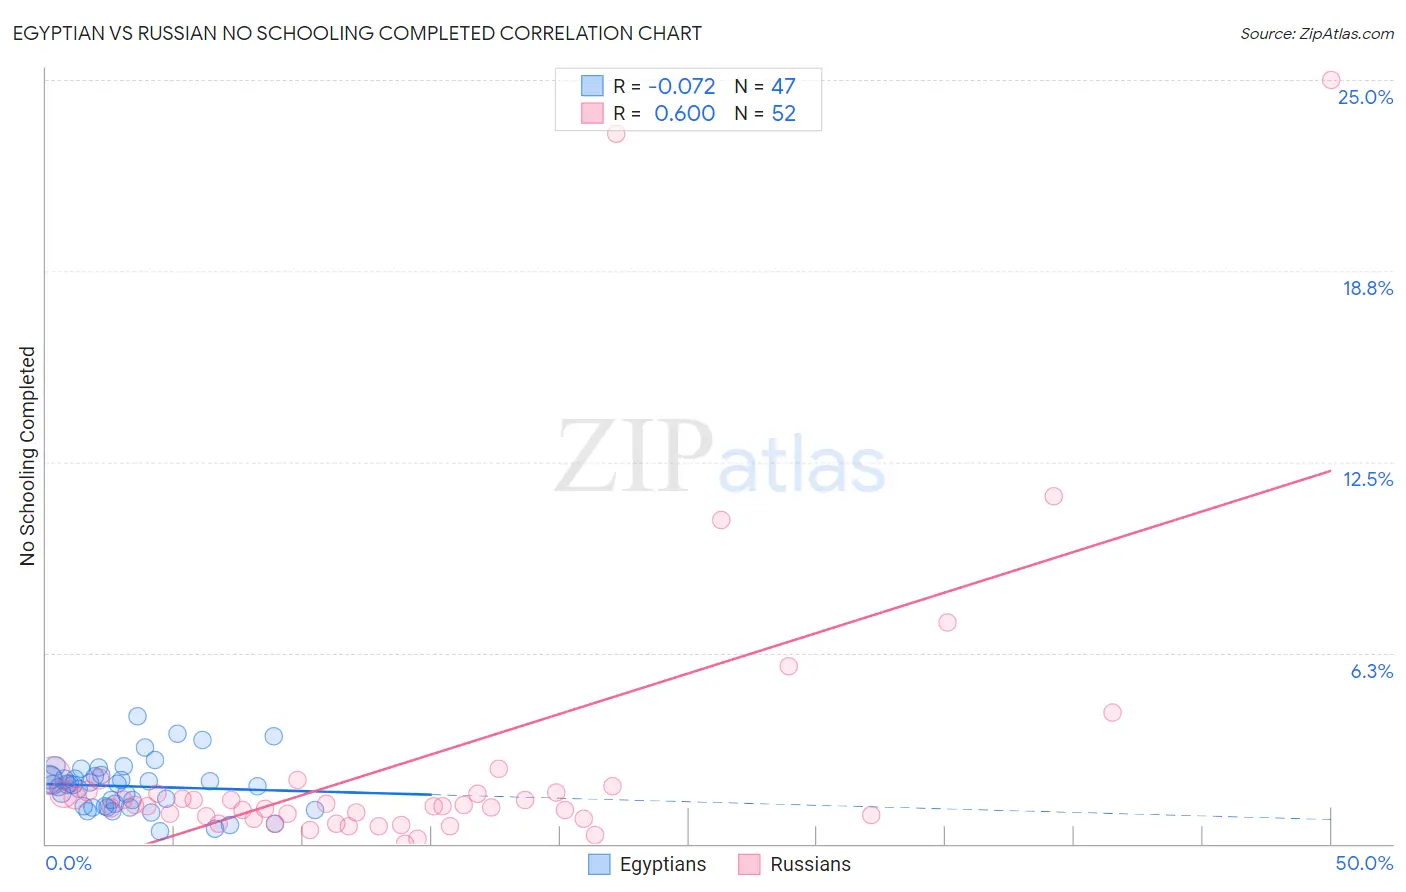
Egyptian vs Russian No Schooling Completed Correlation Chart

The statistical analysis conducted on geographies consisting of 275,573,991 people shows a slight negative correlation between the proportion of Egyptians and percentage of population with no schooling in the United States with a correlation coefficient (R) of -0.072 and weighted average of 2.1%. Similarly, the statistical analysis conducted on geographies consisting of 500,481,409 people shows a significant positive correlation between the proportion of Russians and percentage of population with no schooling in the United States with a correlation coefficient (R) of 0.600 and weighted average of 1.7%, a difference of 23.8%.
Egyptian vs Russian No Schooling Completed

No Schooling Completed Correlation Summary

MeasurementEgyptianRussian
Minimum0.40%0.017%
Maximum4.2%25.0%
Range3.8%25.0%
Mean1.9%2.7%
Median1.9%1.3%
Interquartile 25% (IQ1)1.2%0.87%
Interquartile 75% (IQ3)2.2%1.7%
Interquartile Range (IQR)1.0%0.83%
Standard Deviation (Sample)0.82%4.9%
Standard Deviation (Population)0.81%4.8%

Similar Demographics by No Schooling Completed

Demographics Similar to Egyptians by No Schooling Completed

In terms of no schooling completed, the demographic groups most similar to Egyptians are Cheyenne (2.1%, a difference of 0.080%), Dutch West Indian (2.1%, a difference of 0.10%), Brazilian (2.1%, a difference of 0.15%), Comanche (2.1%, a difference of 0.21%), and Apache (2.1%, a difference of 0.35%).
DemographicsRating | RankNo Schooling Completed
Kenyans
65.7
/100
|
#160
Good
2.0%
Ugandans
64.6
/100
|
#161
Good
2.0%
Immigrants | Brazil
63.8
/100
|
#162
Good
2.1%
Albanians
62.2
/100
|
#163
Good
2.1%
Comanche
60.7
/100
|
#164
Good
2.1%
Brazilians
60.2
/100
|
#165
Good
2.1%
Dutch West Indians
59.9
/100
|
#166
Average
2.1%
Egyptians
59.2
/100
|
#167
Average
2.1%
Cheyenne
58.6
/100
|
#168
Average
2.1%
Apache
56.7
/100
|
#169
Average
2.1%
Argentineans
56.0
/100
|
#170
Average
2.1%
Immigrants | Poland
55.2
/100
|
#171
Average
2.1%
Immigrants | Argentina
52.7
/100
|
#172
Average
2.1%
Immigrants | Belarus
51.8
/100
|
#173
Average
2.1%
Immigrants | Micronesia
50.0
/100
|
#174
Average
2.1%

Demographics Similar to Russians by No Schooling Completed

In terms of no schooling completed, the demographic groups most similar to Russians are Immigrants from Northern Europe (1.7%, a difference of 0.040%), New Zealander (1.7%, a difference of 0.16%), Serbian (1.7%, a difference of 0.20%), Canadian (1.7%, a difference of 0.34%), and Immigrants from Austria (1.7%, a difference of 0.53%).
DemographicsRating | RankNo Schooling Completed
Immigrants | North America
99.8
/100
|
#56
Exceptional
1.6%
Austrians
99.8
/100
|
#57
Exceptional
1.6%
Kiowa
99.8
/100
|
#58
Exceptional
1.6%
Slavs
99.8
/100
|
#59
Exceptional
1.7%
Americans
99.8
/100
|
#60
Exceptional
1.7%
Tsimshian
99.8
/100
|
#61
Exceptional
1.7%
Immigrants | Northern Europe
99.8
/100
|
#62
Exceptional
1.7%
Russians
99.8
/100
|
#63
Exceptional
1.7%
New Zealanders
99.7
/100
|
#64
Exceptional
1.7%
Serbians
99.7
/100
|
#65
Exceptional
1.7%
Canadians
99.7
/100
|
#66
Exceptional
1.7%
Immigrants | Austria
99.7
/100
|
#67
Exceptional
1.7%
Immigrants | Lithuania
99.7
/100
|
#68
Exceptional
1.7%
Chickasaw
99.6
/100
|
#69
Exceptional
1.7%
Immigrants | Netherlands
99.6
/100
|
#70
Exceptional
1.7%