Egyptian vs Menominee 11th Grade
COMPARE
Egyptian
Menominee
11th Grade
11th Grade Comparison
Egyptians
Menominee
93.0%
11TH GRADE
89.5/ 100
METRIC RATING
131st/ 347
METRIC RANK
93.5%
11TH GRADE
98.7/ 100
METRIC RATING
99th/ 347
METRIC RANK
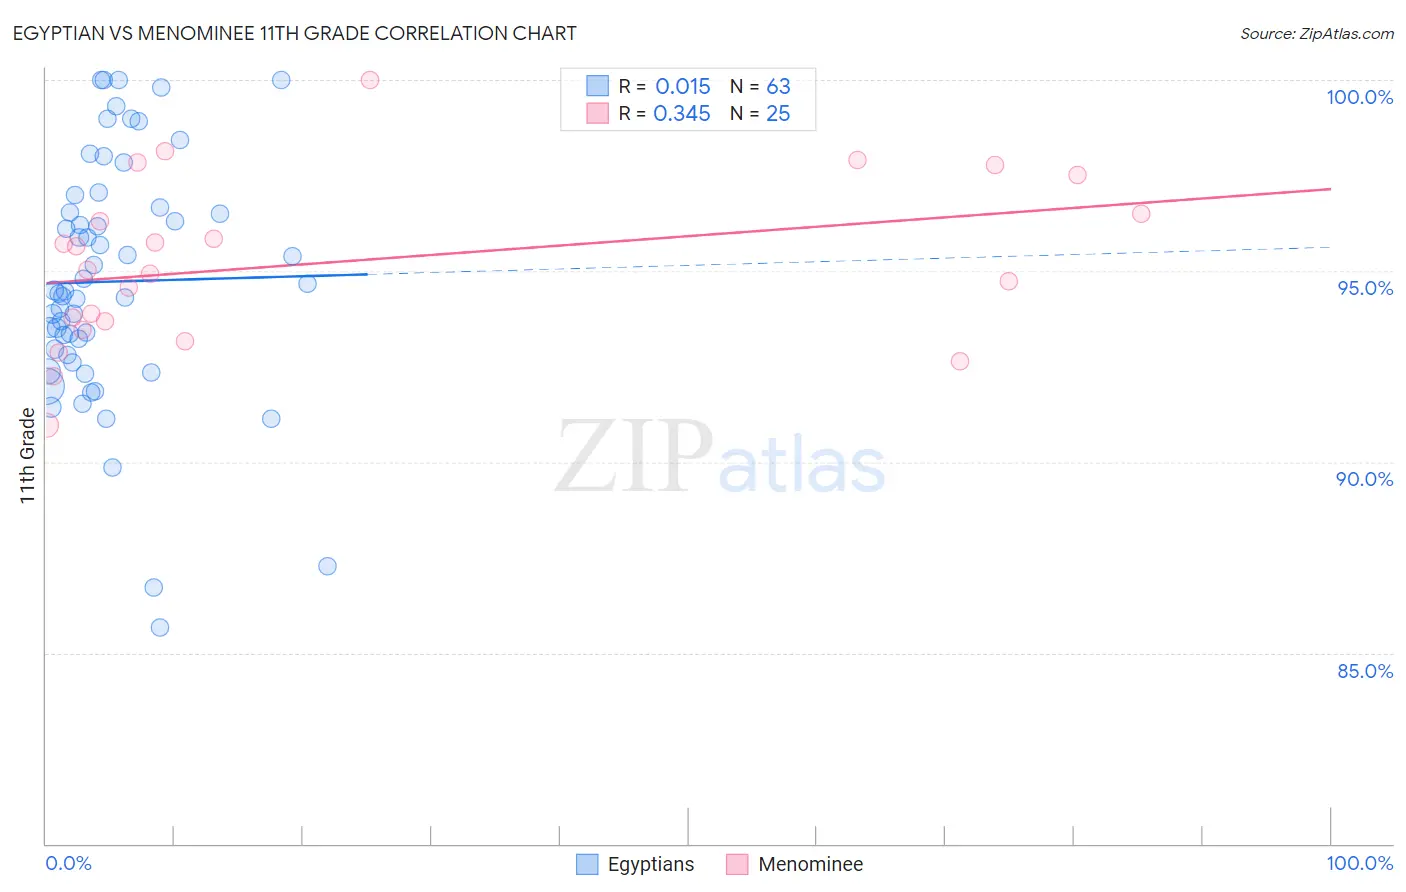
Egyptian vs Menominee 11th Grade Correlation Chart
The statistical analysis conducted on geographies consisting of 276,927,519 people shows no correlation between the proportion of Egyptians and percentage of population with at least 11th grade education in the United States with a correlation coefficient (R) of 0.015 and weighted average of 93.0%. Similarly, the statistical analysis conducted on geographies consisting of 45,778,829 people shows a mild positive correlation between the proportion of Menominee and percentage of population with at least 11th grade education in the United States with a correlation coefficient (R) of 0.345 and weighted average of 93.5%, a difference of 0.54%.
11th Grade Correlation Summary
| Measurement | Egyptian | Menominee |
| Minimum | 85.7% | 91.0% |
| Maximum | 100.0% | 100.0% |
| Range | 14.3% | 9.0% |
| Mean | 94.7% | 95.2% |
| Median | 94.5% | 95.0% |
| Interquartile 25% (IQ1) | 92.8% | 93.6% |
| Interquartile 75% (IQ3) | 96.7% | 97.0% |
| Interquartile Range (IQR) | 3.9% | 3.4% |
| Standard Deviation (Sample) | 3.2% | 2.2% |
| Standard Deviation (Population) | 3.2% | 2.1% |
Similar Demographics by 11th Grade
Demographics Similar to Egyptians by 11th Grade
In terms of 11th grade, the demographic groups most similar to Egyptians are Albanian (93.0%, a difference of 0.0%), Immigrants from Ukraine (93.0%, a difference of 0.010%), Immigrants from Bosnia and Herzegovina (93.0%, a difference of 0.010%), Mongolian (93.0%, a difference of 0.050%), and Delaware (93.0%, a difference of 0.050%).
| Demographics | Rating | Rank | 11th Grade |
| Immigrants | Eastern Europe | 95.9 /100 | #124 | Exceptional 93.2% |
| Immigrants | Sri Lanka | 95.6 /100 | #125 | Exceptional 93.2% |
| Basques | 95.2 /100 | #126 | Exceptional 93.2% |
| Immigrants | Kazakhstan | 92.4 /100 | #127 | Exceptional 93.1% |
| Immigrants | Jordan | 92.4 /100 | #128 | Exceptional 93.1% |
| Immigrants | Ukraine | 89.8 /100 | #129 | Excellent 93.0% |
| Albanians | 89.5 /100 | #130 | Excellent 93.0% |
| Egyptians | 89.5 /100 | #131 | Excellent 93.0% |
| Immigrants | Bosnia and Herzegovina | 89.0 /100 | #132 | Excellent 93.0% |
| Mongolians | 87.6 /100 | #133 | Excellent 93.0% |
| Delaware | 87.3 /100 | #134 | Excellent 93.0% |
| Immigrants | Italy | 86.6 /100 | #135 | Excellent 92.9% |
| Cree | 85.9 /100 | #136 | Excellent 92.9% |
| Arabs | 85.4 /100 | #137 | Excellent 92.9% |
| Immigrants | Brazil | 85.1 /100 | #138 | Excellent 92.9% |
Demographics Similar to Menominee by 11th Grade
In terms of 11th grade, the demographic groups most similar to Menominee are Immigrants from Israel (93.5%, a difference of 0.0%), Immigrants from North Macedonia (93.5%, a difference of 0.010%), Immigrants from Iran (93.5%, a difference of 0.020%), Immigrants from Romania (93.5%, a difference of 0.020%), and Immigrants from Turkey (93.5%, a difference of 0.030%).
| Demographics | Rating | Rank | 11th Grade |
| Immigrants | Bulgaria | 99.1 /100 | #92 | Exceptional 93.6% |
| Puget Sound Salish | 99.1 /100 | #93 | Exceptional 93.6% |
| Swiss | 99.0 /100 | #94 | Exceptional 93.6% |
| Immigrants | France | 99.0 /100 | #95 | Exceptional 93.6% |
| Immigrants | Turkey | 98.9 /100 | #96 | Exceptional 93.5% |
| Immigrants | Iran | 98.9 /100 | #97 | Exceptional 93.5% |
| Immigrants | Israel | 98.8 /100 | #98 | Exceptional 93.5% |
| Menominee | 98.7 /100 | #99 | Exceptional 93.5% |
| Immigrants | North Macedonia | 98.7 /100 | #100 | Exceptional 93.5% |
| Immigrants | Romania | 98.7 /100 | #101 | Exceptional 93.5% |
| Chippewa | 98.6 /100 | #102 | Exceptional 93.5% |
| Lebanese | 98.6 /100 | #103 | Exceptional 93.5% |
| Immigrants | Europe | 98.6 /100 | #104 | Exceptional 93.5% |
| Immigrants | Serbia | 98.6 /100 | #105 | Exceptional 93.5% |
| Immigrants | Croatia | 98.6 /100 | #106 | Exceptional 93.5% |