Egyptian vs Immigrants from Russia 1st Grade

COMPARE

Egyptian
Race
Ancestry
AfghanAfricanAlaska NativeAlaskan AthabascanAlbanianAleutAlsatianAmericanApacheArabArapahoArgentineanArmenianAssyrian/Chaldean/SyriacAustralianAustrianBahamianBangladeshiBarbadianBasqueBelgianBelizeanBermudanBhutaneseBlackfeetBolivianBrazilianBritishBritish West IndianBulgarianBurmeseCajunCambodianCanadianCape VerdeanCarpatho RusynCelticCentral AmericanCentral American IndianCherokeeCheyenneChickasawChileanChineseChippewaChoctawColombianColvilleComancheCosta RicanCreeCreekCroatianCrowCubanCypriotCzechCzechoslovakianDanishDelawareDominicanDutchDutch West IndianEastern EuropeanEcuadorianEgyptianEnglishEstonianEthiopianEuropeanFijianFilipinoFinnishFrenchFrench American IndianFrench CanadianGermanGerman RussianGhanaianGreekGuamanian/ChamorroGuatemalanGuyaneseHaitianHmongHonduranHopiHoumaHungarianIcelanderIndian (Asian)IndonesianInupiatIranianIraqiIrishIroquoisIsraeliItalianJamaicanJapaneseJordanianKenyanKiowaKoreanLaotianLatvianLebaneseLiberianLithuanianLumbeeLuxembourgerMacedonianMalaysianMalteseMarshalleseMenomineeMexicanMexican American IndianMongolianMoroccanNative HawaiianNavajoNepaleseNew ZealanderNicaraguanNigerianNorthern EuropeanNorwegianOkinawanOsageOttawaPaiutePakistaniPalestinianPanamanianParaguayanPennsylvania GermanPeruvianPimaPolishPortuguesePotawatomiPuebloPuerto RicanPuget Sound SalishRomanianRussianSalvadoranSamoanScandinavianScotch-IrishScottishSeminoleSenegaleseSerbianShoshoneSierra LeoneanSiouxSlavicSlovakSloveneSomaliSouth AfricanSouth AmericanSouth American IndianSoviet UnionSpaniardSpanishSpanish AmericanSpanish American IndianSri LankanSubsaharan AfricanSudaneseSwedishSwissSyrianTaiwaneseThaiTlingit-HaidaTohono O'OdhamTonganTrinidadian and TobagonianTsimshianTurkishU.S. Virgin IslanderUgandanUkrainianUruguayanUteVenezuelanVietnameseWelshWest IndianYakamaYaquiYugoslavianYumanYup'ikZimbabwean
Immigration
NonimmigrantsImmigrantsAfghanistanAfricaAlbaniaArgentinaArmeniaAsiaAustraliaAustriaBahamasBangladeshBarbadosBelarusBelgiumBelizeBoliviaBosnia and HerzegovinaBrazilBulgariaBurma/MyanmarCabo VerdeCambodiaCameroonCanadaCaribbeanCentral AmericaChileChinaColombiaCongoCosta RicaCroatiaCubaCzechoslovakiaDenmarkDominicaDominican RepublicEastern AfricaEastern AsiaEastern EuropeEcuadorEgyptEl SalvadorEnglandEritreaEthiopiaEuropeFijiFranceGermanyGhanaGreeceGrenadaGuatemalaGuyanaHaitiHondurasHong KongHungaryIndiaIndonesiaIranIraqIrelandIsraelItalyJamaicaJapanJordanKazakhstanKenyaKoreaKuwaitLaosLatin AmericaLatviaLebanonLiberiaLithuaniaMalaysiaMexicoMicronesiaMiddle AfricaMoldovaMoroccoNepalNetherlandsNicaraguaNigeriaNorth AmericaNorth MacedoniaNorthern AfricaNorthern EuropeNorwayOceaniaPakistanPanamaPeruPhilippinesPolandPortugalRomaniaSaudi ArabiaScotlandSenegalSerbiaSierra LeoneSingaporeSomaliaSouth AfricaSouth AmericaSouth Central AsiaSouth Eastern AsiaSouthern EuropeSpainSri LankaSt. Vincent and the GrenadinesSudanSwedenSwitzerlandSyriaTaiwanThailandTrinidad and TobagoTurkeyUgandaUkraineUruguayUzbekistanVenezuelaVietnamWest IndiesWestern AfricaWestern AsiaWestern EuropeYemenZaireZimbabweAzores
Immigrants from Russia
Race
Ancestry
AfghanAfricanAlaska NativeAlaskan AthabascanAlbanianAleutAlsatianAmericanApacheArabArapahoArgentineanArmenianAssyrian/Chaldean/SyriacAustralianAustrianBahamianBangladeshiBarbadianBasqueBelgianBelizeanBermudanBhutaneseBlackfeetBolivianBrazilianBritishBritish West IndianBulgarianBurmeseCajunCambodianCanadianCape VerdeanCarpatho RusynCelticCentral AmericanCentral American IndianCherokeeCheyenneChickasawChileanChineseChippewaChoctawColombianColvilleComancheCosta RicanCreeCreekCroatianCrowCubanCypriotCzechCzechoslovakianDanishDelawareDominicanDutchDutch West IndianEastern EuropeanEcuadorianEnglishEstonianEthiopianEuropeanFijianFilipinoFinnishFrenchFrench American IndianFrench CanadianGermanGerman RussianGhanaianGreekGuamanian/ChamorroGuatemalanGuyaneseHaitianHmongHonduranHopiHoumaHungarianIcelanderIndian (Asian)IndonesianInupiatIranianIraqiIrishIroquoisIsraeliItalianJamaicanJapaneseJordanianKenyanKiowaKoreanLaotianLatvianLebaneseLiberianLithuanianLumbeeLuxembourgerMacedonianMalaysianMalteseMarshalleseMenomineeMexicanMexican American IndianMongolianMoroccanNative HawaiianNavajoNepaleseNew ZealanderNicaraguanNigerianNorthern EuropeanNorwegianOkinawanOsageOttawaPaiutePakistaniPalestinianPanamanianParaguayanPennsylvania GermanPeruvianPimaPolishPortuguesePotawatomiPuebloPuerto RicanPuget Sound SalishRomanianRussianSalvadoranSamoanScandinavianScotch-IrishScottishSeminoleSenegaleseSerbianShoshoneSierra LeoneanSiouxSlavicSlovakSloveneSomaliSouth AfricanSouth AmericanSouth American IndianSoviet UnionSpaniardSpanishSpanish AmericanSpanish American IndianSri LankanSubsaharan AfricanSudaneseSwedishSwissSyrianTaiwaneseThaiTlingit-HaidaTohono O'OdhamTonganTrinidadian and TobagonianTsimshianTurkishU.S. Virgin IslanderUgandanUkrainianUruguayanUteVenezuelanVietnameseWelshWest IndianYakamaYaquiYugoslavianYumanYup'ikZimbabwean
Immigration
NonimmigrantsImmigrantsAfghanistanAfricaAlbaniaArgentinaArmeniaAsiaAustraliaAustriaBahamasBangladeshBarbadosBelarusBelgiumBelizeBoliviaBosnia and HerzegovinaBrazilBulgariaBurma/MyanmarCabo VerdeCambodiaCameroonCanadaCaribbeanCentral AmericaChileChinaColombiaCongoCosta RicaCroatiaCubaCzechoslovakiaDenmarkDominicaDominican RepublicEastern AfricaEastern AsiaEastern EuropeEcuadorEgyptEl SalvadorEnglandEritreaEthiopiaEuropeFijiFranceGermanyGhanaGreeceGrenadaGuatemalaGuyanaHaitiHondurasHong KongHungaryIndiaIndonesiaIranIraqIrelandIsraelItalyJamaicaJapanJordanKazakhstanKenyaKoreaKuwaitLaosLatin AmericaLatviaLebanonLiberiaLithuaniaMalaysiaMexicoMicronesiaMiddle AfricaMoldovaMoroccoNepalNetherlandsNicaraguaNigeriaNorth AmericaNorth MacedoniaNorthern AfricaNorthern EuropeNorwayOceaniaPakistanPanamaPeruPhilippinesPolandPortugalRomaniaRussiaSaudi ArabiaScotlandSenegalSerbiaSierra LeoneSingaporeSomaliaSouth AfricaSouth AmericaSouth Central AsiaSouth Eastern AsiaSouthern EuropeSpainSri LankaSt. Vincent and the GrenadinesSudanSwedenSwitzerlandSyriaTaiwanThailandTrinidad and TobagoTurkeyUgandaUkraineUruguayUzbekistanVenezuelaVietnamWest IndiesWestern AfricaWestern AsiaWestern EuropeYemenZaireZimbabweAzores
1st Grade
Income
Poverty
Unemployment
Labor Participation
Family Structure
Vehicle Availability
Education Level
Disability

1st Grade Comparison

Egyptians

Immigrants from Russia

Average
Average
97.9%
1ST GRADE
42.7/ 100
METRIC RATING
182nd/ 347
METRIC RANK
97.9%
1ST GRADE
59.2/ 100
METRIC RATING
160th/ 347
METRIC RANK

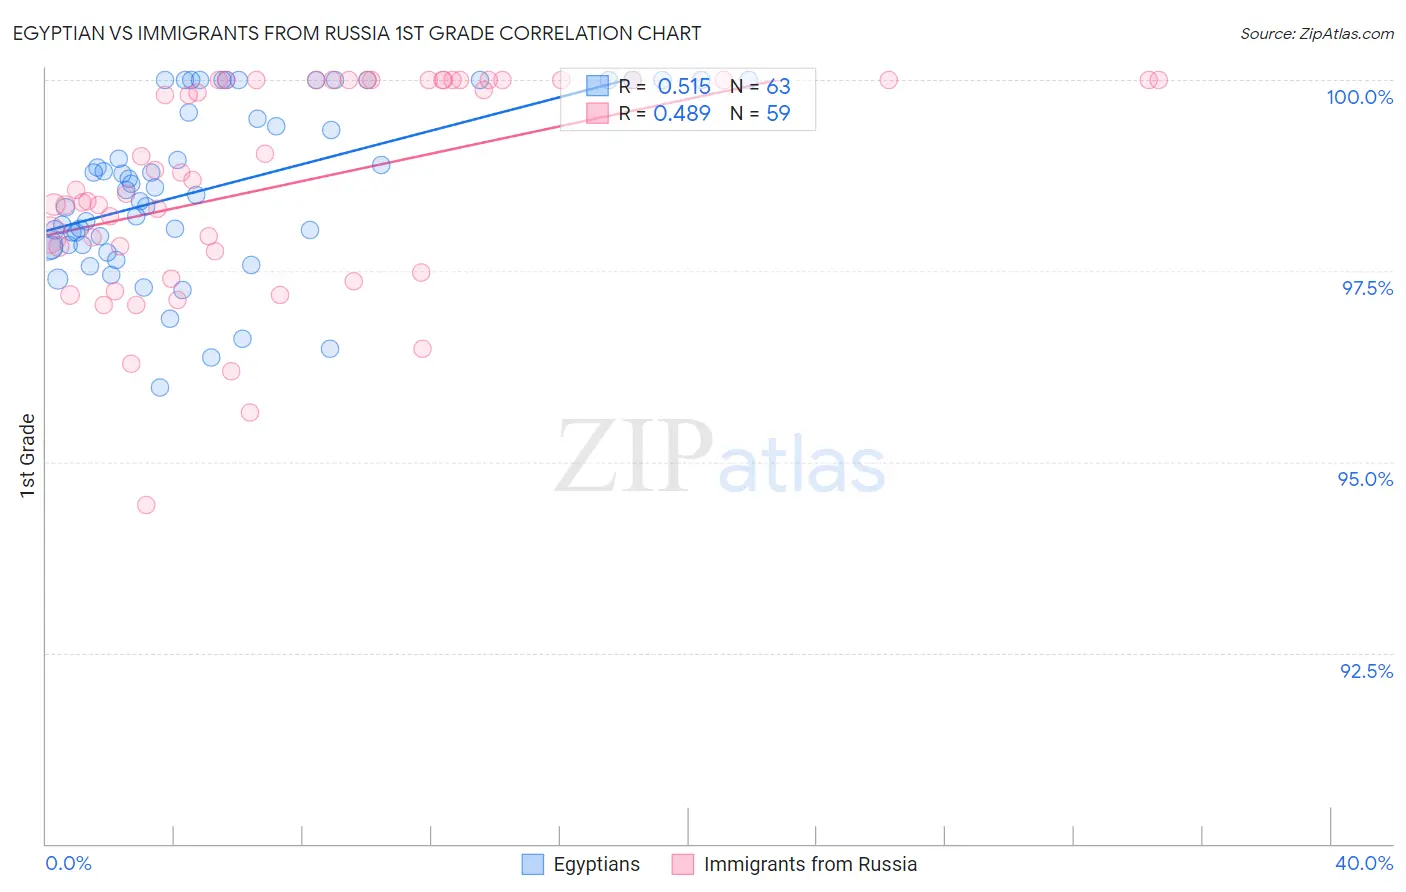
Egyptian vs Immigrants from Russia 1st Grade Correlation Chart

The statistical analysis conducted on geographies consisting of 276,927,519 people shows a substantial positive correlation between the proportion of Egyptians and percentage of population with at least 1st grade education in the United States with a correlation coefficient (R) of 0.515 and weighted average of 97.9%. Similarly, the statistical analysis conducted on geographies consisting of 347,948,494 people shows a moderate positive correlation between the proportion of Immigrants from Russia and percentage of population with at least 1st grade education in the United States with a correlation coefficient (R) of 0.489 and weighted average of 97.9%, a difference of 0.050%.
Egyptian vs Immigrants from Russia 1st Grade

1st Grade Correlation Summary

MeasurementEgyptianImmigrants from Russia
Minimum96.0%94.4%
Maximum100.0%100.0%
Range4.0%5.6%
Mean98.6%98.7%
Median98.6%98.7%
Interquartile 25% (IQ1)97.8%97.8%
Interquartile 75% (IQ3)100.0%100.0%
Interquartile Range (IQR)2.2%2.2%
Standard Deviation (Sample)1.1%1.4%
Standard Deviation (Population)1.1%1.4%

Similar Demographics by 1st Grade

Demographics Similar to Egyptians by 1st Grade

In terms of 1st grade, the demographic groups most similar to Egyptians are Portuguese (97.9%, a difference of 0.0%), Immigrants from Argentina (97.9%, a difference of 0.0%), Argentinean (97.9%, a difference of 0.010%), Immigrants from Bosnia and Herzegovina (97.9%, a difference of 0.010%), and Immigrants from Poland (97.9%, a difference of 0.010%).
DemographicsRating | Rank1st Grade
Immigrants | Sri Lanka
49.7
/100
|
#175
Average
97.9%
Albanians
49.6
/100
|
#176
Average
97.9%
Immigrants | Brazil
49.1
/100
|
#177
Average
97.9%
Immigrants | Venezuela
47.8
/100
|
#178
Average
97.9%
Argentineans
47.2
/100
|
#179
Average
97.9%
Immigrants | Bosnia and Herzegovina
46.6
/100
|
#180
Average
97.9%
Portuguese
44.2
/100
|
#181
Average
97.9%
Egyptians
42.7
/100
|
#182
Average
97.9%
Immigrants | Argentina
41.3
/100
|
#183
Average
97.9%
Immigrants | Poland
40.1
/100
|
#184
Average
97.9%
Immigrants | Belarus
39.3
/100
|
#185
Fair
97.9%
Paiute
36.5
/100
|
#186
Fair
97.9%
Pakistanis
35.8
/100
|
#187
Fair
97.9%
Arabs
35.5
/100
|
#188
Fair
97.9%
Immigrants | Kazakhstan
34.9
/100
|
#189
Fair
97.9%

Demographics Similar to Immigrants from Russia by 1st Grade

In terms of 1st grade, the demographic groups most similar to Immigrants from Russia are Immigrants from Italy (97.9%, a difference of 0.0%), Immigrants from Eastern Europe (97.9%, a difference of 0.0%), Spanish American (97.9%, a difference of 0.0%), Brazilian (97.9%, a difference of 0.010%), and Ugandan (97.9%, a difference of 0.010%).
DemographicsRating | Rank1st Grade
Soviet Union
68.9
/100
|
#153
Good
98.0%
Immigrants | Iran
66.9
/100
|
#154
Good
98.0%
Comanche
66.9
/100
|
#155
Good
98.0%
Immigrants | South Central Asia
66.2
/100
|
#156
Good
98.0%
Immigrants | North Macedonia
65.3
/100
|
#157
Good
98.0%
Venezuelans
64.7
/100
|
#158
Good
98.0%
French American Indians
63.7
/100
|
#159
Good
98.0%
Immigrants | Russia
59.2
/100
|
#160
Average
97.9%
Immigrants | Italy
59.1
/100
|
#161
Average
97.9%
Immigrants | Eastern Europe
58.9
/100
|
#162
Average
97.9%
Spanish Americans
57.7
/100
|
#163
Average
97.9%
Brazilians
57.6
/100
|
#164
Average
97.9%
Ugandans
56.9
/100
|
#165
Average
97.9%
Navajo
56.6
/100
|
#166
Average
97.9%
Bermudans
56.3
/100
|
#167
Average
97.9%