Ecuadorian vs Sudanese Bachelor's Degree
COMPARE
Ecuadorian
Sudanese
Bachelor's Degree
Bachelor's Degree Comparison
Ecuadorians
Sudanese
35.4%
BACHELOR'S DEGREE
6.6/ 100
METRIC RATING
227th/ 347
METRIC RANK
38.9%
BACHELOR'S DEGREE
76.4/ 100
METRIC RATING
152nd/ 347
METRIC RANK
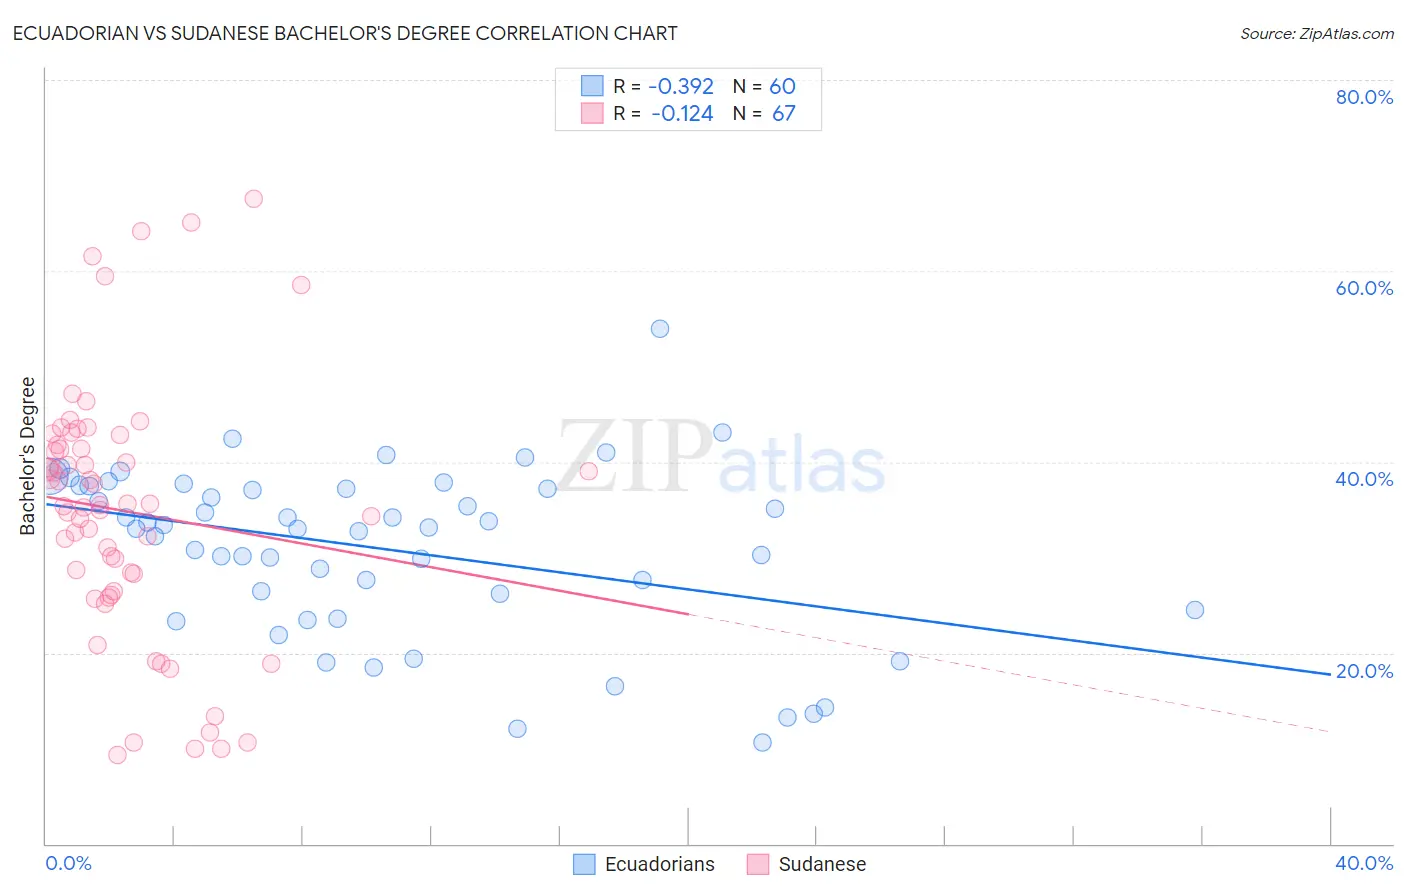
Ecuadorian vs Sudanese Bachelor's Degree Correlation Chart
The statistical analysis conducted on geographies consisting of 317,830,457 people shows a mild negative correlation between the proportion of Ecuadorians and percentage of population with at least bachelor's degree education in the United States with a correlation coefficient (R) of -0.392 and weighted average of 35.4%. Similarly, the statistical analysis conducted on geographies consisting of 110,140,841 people shows a poor negative correlation between the proportion of Sudanese and percentage of population with at least bachelor's degree education in the United States with a correlation coefficient (R) of -0.124 and weighted average of 38.9%, a difference of 10.0%.
Bachelor's Degree Correlation Summary
| Measurement | Ecuadorian | Sudanese |
| Minimum | 10.6% | 9.3% |
| Maximum | 53.9% | 67.6% |
| Range | 43.3% | 58.3% |
| Mean | 30.9% | 34.8% |
| Median | 33.1% | 35.5% |
| Interquartile 25% (IQ1) | 25.3% | 26.5% |
| Interquartile 75% (IQ3) | 37.4% | 41.8% |
| Interquartile Range (IQR) | 12.1% | 15.3% |
| Standard Deviation (Sample) | 8.9% | 13.4% |
| Standard Deviation (Population) | 8.8% | 13.3% |
Similar Demographics by Bachelor's Degree
Demographics Similar to Ecuadorians by Bachelor's Degree
In terms of bachelor's degree, the demographic groups most similar to Ecuadorians are Immigrants from Trinidad and Tobago (35.3%, a difference of 0.23%), Portuguese (35.5%, a difference of 0.26%), Immigrants from Burma/Myanmar (35.5%, a difference of 0.30%), White/Caucasian (35.3%, a difference of 0.31%), and Immigrants from Barbados (35.5%, a difference of 0.37%).
| Demographics | Rating | Rank | Bachelor's Degree |
| Spanish | 9.6 /100 | #220 | Tragic 35.8% |
| Dutch | 9.2 /100 | #221 | Tragic 35.7% |
| Trinidadians and Tobagonians | 8.8 /100 | #222 | Tragic 35.7% |
| French Canadians | 8.3 /100 | #223 | Tragic 35.6% |
| Immigrants | Barbados | 7.5 /100 | #224 | Tragic 35.5% |
| Immigrants | Burma/Myanmar | 7.3 /100 | #225 | Tragic 35.5% |
| Portuguese | 7.2 /100 | #226 | Tragic 35.5% |
| Ecuadorians | 6.6 /100 | #227 | Tragic 35.4% |
| Immigrants | Trinidad and Tobago | 6.0 /100 | #228 | Tragic 35.3% |
| Whites/Caucasians | 5.9 /100 | #229 | Tragic 35.3% |
| Immigrants | Grenada | 4.3 /100 | #230 | Tragic 35.0% |
| Immigrants | St. Vincent and the Grenadines | 4.3 /100 | #231 | Tragic 35.0% |
| Hmong | 3.4 /100 | #232 | Tragic 34.8% |
| Immigrants | Ecuador | 3.3 /100 | #233 | Tragic 34.7% |
| Guamanians/Chamorros | 3.0 /100 | #234 | Tragic 34.6% |
Demographics Similar to Sudanese by Bachelor's Degree
In terms of bachelor's degree, the demographic groups most similar to Sudanese are Immigrants from Africa (38.9%, a difference of 0.020%), Slavic (38.9%, a difference of 0.060%), South American (38.9%, a difference of 0.12%), Immigrants from Poland (39.0%, a difference of 0.15%), and Canadian (38.8%, a difference of 0.18%).
| Demographics | Rating | Rank | Bachelor's Degree |
| Slovenes | 79.5 /100 | #145 | Good 39.1% |
| Swedes | 79.2 /100 | #146 | Good 39.1% |
| Immigrants | Sierra Leone | 79.0 /100 | #147 | Good 39.0% |
| Iraqis | 78.1 /100 | #148 | Good 39.0% |
| Immigrants | Poland | 77.5 /100 | #149 | Good 39.0% |
| South Americans | 77.3 /100 | #150 | Good 38.9% |
| Immigrants | Africa | 76.5 /100 | #151 | Good 38.9% |
| Sudanese | 76.4 /100 | #152 | Good 38.9% |
| Slavs | 75.9 /100 | #153 | Good 38.9% |
| Canadians | 75.0 /100 | #154 | Good 38.8% |
| Immigrants | Kenya | 73.8 /100 | #155 | Good 38.8% |
| Kenyans | 72.5 /100 | #156 | Good 38.7% |
| Immigrants | South America | 70.1 /100 | #157 | Good 38.6% |
| Immigrants | Germany | 69.6 /100 | #158 | Good 38.6% |
| Chinese | 66.6 /100 | #159 | Good 38.5% |