Dutch West Indian vs Central American Master's Degree
COMPARE
Dutch West Indian
Central American
Master's Degree
Master's Degree Comparison
Dutch West Indians
Central Americans
10.6%
MASTER'S DEGREE
0.0/ 100
METRIC RATING
324th/ 347
METRIC RANK
12.2%
MASTER'S DEGREE
0.3/ 100
METRIC RATING
269th/ 347
METRIC RANK
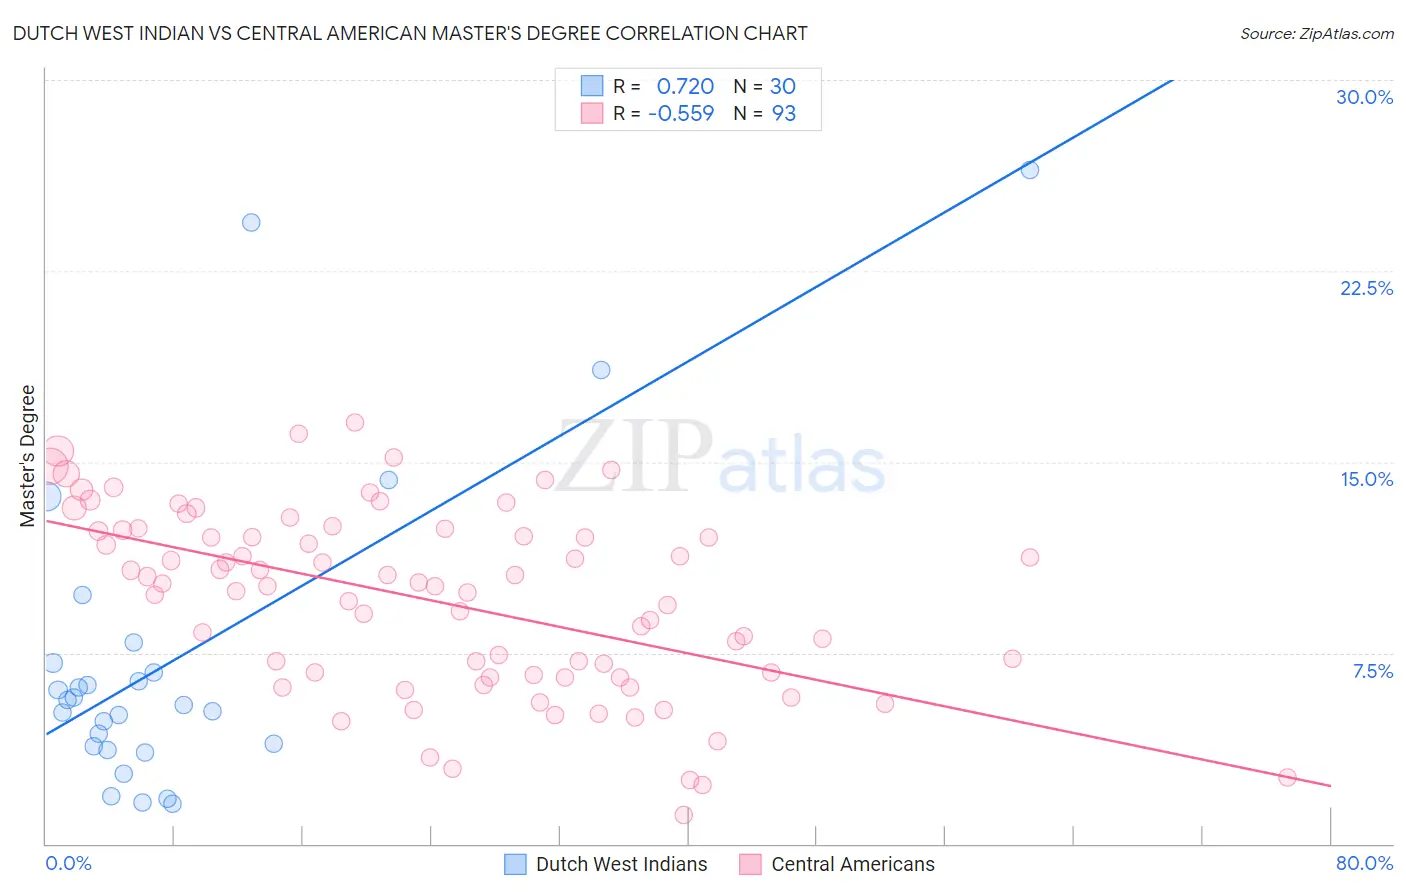
Dutch West Indian vs Central American Master's Degree Correlation Chart
The statistical analysis conducted on geographies consisting of 85,760,776 people shows a strong positive correlation between the proportion of Dutch West Indians and percentage of population with at least master's degree education in the United States with a correlation coefficient (R) of 0.720 and weighted average of 10.6%. Similarly, the statistical analysis conducted on geographies consisting of 504,206,003 people shows a substantial negative correlation between the proportion of Central Americans and percentage of population with at least master's degree education in the United States with a correlation coefficient (R) of -0.559 and weighted average of 12.2%, a difference of 14.7%.
Master's Degree Correlation Summary
| Measurement | Dutch West Indian | Central American |
| Minimum | 1.6% | 1.1% |
| Maximum | 26.5% | 16.6% |
| Range | 24.9% | 15.4% |
| Mean | 7.3% | 9.5% |
| Median | 5.5% | 10.1% |
| Interquartile 25% (IQ1) | 3.8% | 6.6% |
| Interquartile 75% (IQ3) | 7.1% | 12.3% |
| Interquartile Range (IQR) | 3.3% | 5.7% |
| Standard Deviation (Sample) | 6.2% | 3.6% |
| Standard Deviation (Population) | 6.1% | 3.6% |
Similar Demographics by Master's Degree
Demographics Similar to Dutch West Indians by Master's Degree
In terms of master's degree, the demographic groups most similar to Dutch West Indians are Crow (10.6%, a difference of 0.040%), Sioux (10.7%, a difference of 0.44%), Pennsylvania German (10.7%, a difference of 1.1%), Inupiat (10.5%, a difference of 1.1%), and Creek (10.5%, a difference of 1.1%).
| Demographics | Rating | Rank | Master's Degree |
| Hopi | 0.0 /100 | #317 | Tragic 10.9% |
| Immigrants | Cuba | 0.0 /100 | #318 | Tragic 10.9% |
| Kiowa | 0.0 /100 | #319 | Tragic 10.8% |
| Immigrants | Micronesia | 0.0 /100 | #320 | Tragic 10.8% |
| Pennsylvania Germans | 0.0 /100 | #321 | Tragic 10.7% |
| Sioux | 0.0 /100 | #322 | Tragic 10.7% |
| Crow | 0.0 /100 | #323 | Tragic 10.6% |
| Dutch West Indians | 0.0 /100 | #324 | Tragic 10.6% |
| Inupiat | 0.0 /100 | #325 | Tragic 10.5% |
| Creek | 0.0 /100 | #326 | Tragic 10.5% |
| Paiute | 0.0 /100 | #327 | Tragic 10.5% |
| Bangladeshis | 0.0 /100 | #328 | Tragic 10.5% |
| Nepalese | 0.0 /100 | #329 | Tragic 10.5% |
| Fijians | 0.0 /100 | #330 | Tragic 10.3% |
| Pueblo | 0.0 /100 | #331 | Tragic 10.3% |
Demographics Similar to Central Americans by Master's Degree
In terms of master's degree, the demographic groups most similar to Central Americans are Salvadoran (12.2%, a difference of 0.13%), Native Hawaiian (12.3%, a difference of 0.65%), Haitian (12.1%, a difference of 0.72%), Comanche (12.1%, a difference of 0.78%), and Blackfeet (12.1%, a difference of 0.87%).
| Demographics | Rating | Rank | Master's Degree |
| Nicaraguans | 0.6 /100 | #262 | Tragic 12.5% |
| Central American Indians | 0.5 /100 | #263 | Tragic 12.4% |
| Belizeans | 0.5 /100 | #264 | Tragic 12.4% |
| Immigrants | Fiji | 0.5 /100 | #265 | Tragic 12.4% |
| Bahamians | 0.5 /100 | #266 | Tragic 12.4% |
| Americans | 0.4 /100 | #267 | Tragic 12.3% |
| Native Hawaiians | 0.4 /100 | #268 | Tragic 12.3% |
| Central Americans | 0.3 /100 | #269 | Tragic 12.2% |
| Salvadorans | 0.3 /100 | #270 | Tragic 12.2% |
| Haitians | 0.3 /100 | #271 | Tragic 12.1% |
| Comanche | 0.3 /100 | #272 | Tragic 12.1% |
| Blackfeet | 0.3 /100 | #273 | Tragic 12.1% |
| Cape Verdeans | 0.3 /100 | #274 | Tragic 12.1% |
| Cubans | 0.3 /100 | #275 | Tragic 12.1% |
| Blacks/African Americans | 0.3 /100 | #276 | Tragic 12.1% |