Delaware vs Immigrants from Guatemala 2nd Grade

COMPARE

Delaware
Race
Ancestry
AfghanAfricanAlaska NativeAlaskan AthabascanAlbanianAleutAlsatianAmericanApacheArabArapahoArgentineanArmenianAssyrian/Chaldean/SyriacAustralianAustrianBahamianBangladeshiBarbadianBasqueBelgianBelizeanBermudanBhutaneseBlackfeetBolivianBrazilianBritishBritish West IndianBulgarianBurmeseCajunCambodianCanadianCape VerdeanCarpatho RusynCelticCentral AmericanCentral American IndianCherokeeCheyenneChickasawChileanChineseChippewaChoctawColombianColvilleComancheCosta RicanCreeCreekCroatianCrowCubanCypriotCzechCzechoslovakianDanishDelawareDominicanDutchDutch West IndianEastern EuropeanEcuadorianEgyptianEnglishEstonianEthiopianEuropeanFijianFilipinoFinnishFrenchFrench American IndianFrench CanadianGermanGerman RussianGhanaianGreekGuamanian/ChamorroGuatemalanGuyaneseHaitianHmongHonduranHopiHoumaHungarianIcelanderIndian (Asian)IndonesianInupiatIranianIraqiIrishIroquoisIsraeliItalianJamaicanJapaneseJordanianKenyanKiowaKoreanLaotianLatvianLebaneseLiberianLithuanianLumbeeLuxembourgerMacedonianMalaysianMalteseMarshalleseMenomineeMexicanMexican American IndianMongolianMoroccanNative HawaiianNavajoNepaleseNew ZealanderNicaraguanNigerianNorthern EuropeanNorwegianOkinawanOsageOttawaPaiutePakistaniPalestinianPanamanianParaguayanPennsylvania GermanPeruvianPimaPolishPortuguesePotawatomiPuebloPuerto RicanPuget Sound SalishRomanianRussianSalvadoranSamoanScandinavianScotch-IrishScottishSeminoleSenegaleseSerbianShoshoneSierra LeoneanSiouxSlavicSlovakSloveneSomaliSouth AfricanSouth AmericanSouth American IndianSoviet UnionSpaniardSpanishSpanish AmericanSpanish American IndianSri LankanSubsaharan AfricanSudaneseSwedishSwissSyrianTaiwaneseThaiTlingit-HaidaTohono O'OdhamTonganTrinidadian and TobagonianTsimshianTurkishU.S. Virgin IslanderUgandanUkrainianUruguayanUteVenezuelanVietnameseWelshWest IndianYakamaYaquiYugoslavianYumanYup'ikZimbabwean
Immigration
NonimmigrantsImmigrantsAfghanistanAfricaAlbaniaArgentinaArmeniaAsiaAustraliaAustriaBahamasBangladeshBarbadosBelarusBelgiumBelizeBoliviaBosnia and HerzegovinaBrazilBulgariaBurma/MyanmarCabo VerdeCambodiaCameroonCanadaCaribbeanCentral AmericaChileChinaColombiaCongoCosta RicaCroatiaCubaCzechoslovakiaDenmarkDominicaDominican RepublicEastern AfricaEastern AsiaEastern EuropeEcuadorEgyptEl SalvadorEnglandEritreaEthiopiaEuropeFijiFranceGermanyGhanaGreeceGrenadaGuyanaHaitiHondurasHong KongHungaryIndiaIndonesiaIranIraqIrelandIsraelItalyJamaicaJapanJordanKazakhstanKenyaKoreaKuwaitLaosLatin AmericaLatviaLebanonLiberiaLithuaniaMalaysiaMexicoMicronesiaMiddle AfricaMoldovaMoroccoNepalNetherlandsNicaraguaNigeriaNorth AmericaNorth MacedoniaNorthern AfricaNorthern EuropeNorwayOceaniaPakistanPanamaPeruPhilippinesPolandPortugalRomaniaRussiaSaudi ArabiaScotlandSenegalSerbiaSierra LeoneSingaporeSomaliaSouth AfricaSouth AmericaSouth Central AsiaSouth Eastern AsiaSouthern EuropeSpainSri LankaSt. Vincent and the GrenadinesSudanSwedenSwitzerlandSyriaTaiwanThailandTrinidad and TobagoTurkeyUgandaUkraineUruguayUzbekistanVenezuelaVietnamWest IndiesWestern AfricaWestern AsiaWestern EuropeYemenZaireZimbabweAzores
Immigrants from Guatemala
Race
Ancestry
AfghanAfricanAlaska NativeAlaskan AthabascanAlbanianAleutAlsatianAmericanApacheArabArapahoArgentineanArmenianAssyrian/Chaldean/SyriacAustralianAustrianBahamianBangladeshiBarbadianBasqueBelgianBelizeanBermudanBhutaneseBlackfeetBolivianBrazilianBritishBritish West IndianBulgarianBurmeseCajunCambodianCanadianCape VerdeanCarpatho RusynCelticCentral AmericanCentral American IndianCherokeeCheyenneChickasawChileanChineseChippewaChoctawColombianColvilleComancheCosta RicanCreeCreekCroatianCrowCubanCypriotCzechCzechoslovakianDanishDominicanDutchDutch West IndianEastern EuropeanEcuadorianEgyptianEnglishEstonianEthiopianEuropeanFijianFilipinoFinnishFrenchFrench American IndianFrench CanadianGermanGerman RussianGhanaianGreekGuamanian/ChamorroGuatemalanGuyaneseHaitianHmongHonduranHopiHoumaHungarianIcelanderIndian (Asian)IndonesianInupiatIranianIraqiIrishIroquoisIsraeliItalianJamaicanJapaneseJordanianKenyanKiowaKoreanLaotianLatvianLebaneseLiberianLithuanianLumbeeLuxembourgerMacedonianMalaysianMalteseMarshalleseMenomineeMexicanMexican American IndianMongolianMoroccanNative HawaiianNavajoNepaleseNew ZealanderNicaraguanNigerianNorthern EuropeanNorwegianOkinawanOsageOttawaPaiutePakistaniPalestinianPanamanianParaguayanPennsylvania GermanPeruvianPimaPolishPortuguesePotawatomiPuebloPuerto RicanPuget Sound SalishRomanianRussianSalvadoranSamoanScandinavianScotch-IrishScottishSeminoleSenegaleseSerbianShoshoneSierra LeoneanSiouxSlavicSlovakSloveneSomaliSouth AfricanSouth AmericanSouth American IndianSoviet UnionSpaniardSpanishSpanish AmericanSpanish American IndianSri LankanSubsaharan AfricanSudaneseSwedishSwissSyrianTaiwaneseThaiTlingit-HaidaTohono O'OdhamTonganTrinidadian and TobagonianTsimshianTurkishU.S. Virgin IslanderUgandanUkrainianUruguayanUteVenezuelanVietnameseWelshWest IndianYakamaYaquiYugoslavianYumanYup'ikZimbabwean
Immigration
NonimmigrantsImmigrantsAfghanistanAfricaAlbaniaArgentinaArmeniaAsiaAustraliaAustriaBahamasBangladeshBarbadosBelarusBelgiumBelizeBoliviaBosnia and HerzegovinaBrazilBulgariaBurma/MyanmarCabo VerdeCambodiaCameroonCanadaCaribbeanCentral AmericaChileChinaColombiaCongoCosta RicaCroatiaCubaCzechoslovakiaDenmarkDominicaDominican RepublicEastern AfricaEastern AsiaEastern EuropeEcuadorEgyptEl SalvadorEnglandEritreaEthiopiaEuropeFijiFranceGermanyGhanaGreeceGrenadaGuatemalaGuyanaHaitiHondurasHong KongHungaryIndiaIndonesiaIranIraqIrelandIsraelItalyJamaicaJapanJordanKazakhstanKenyaKoreaKuwaitLaosLatin AmericaLatviaLebanonLiberiaLithuaniaMalaysiaMexicoMicronesiaMiddle AfricaMoldovaMoroccoNepalNetherlandsNicaraguaNigeriaNorth AmericaNorth MacedoniaNorthern AfricaNorthern EuropeNorwayOceaniaPakistanPanamaPeruPhilippinesPolandPortugalRomaniaRussiaSaudi ArabiaScotlandSenegalSerbiaSierra LeoneSingaporeSomaliaSouth AfricaSouth AmericaSouth Central AsiaSouth Eastern AsiaSouthern EuropeSpainSri LankaSt. Vincent and the GrenadinesSudanSwedenSwitzerlandSyriaTaiwanThailandTrinidad and TobagoTurkeyUgandaUkraineUruguayUzbekistanVenezuelaVietnamWest IndiesWestern AfricaWestern AsiaWestern EuropeYemenZaireZimbabweAzores
2nd Grade
Income
Poverty
Unemployment
Labor Participation
Family Structure
Vehicle Availability
Education Level
Disability

2nd Grade Comparison

Delaware

Immigrants from Guatemala

Exceptional
Tragic
98.2%
2ND GRADE
99.1/ 100
METRIC RATING
82nd/ 347
METRIC RANK
96.2%
2ND GRADE
0.0/ 100
METRIC RATING
340th/ 347
METRIC RANK

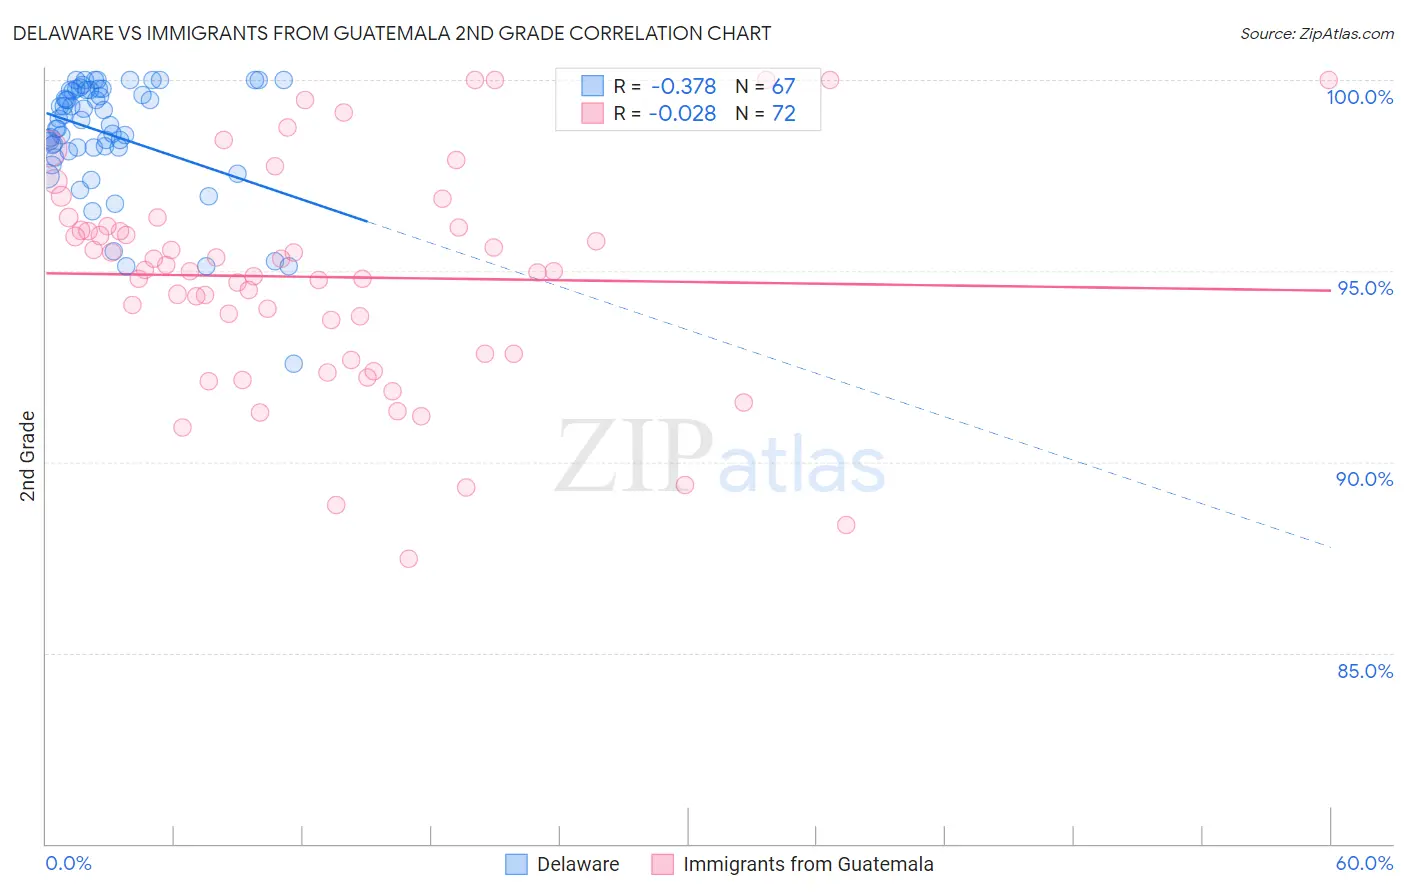
Delaware vs Immigrants from Guatemala 2nd Grade Correlation Chart

The statistical analysis conducted on geographies consisting of 96,234,866 people shows a mild negative correlation between the proportion of Delaware and percentage of population with at least 2nd grade education in the United States with a correlation coefficient (R) of -0.378 and weighted average of 98.2%. Similarly, the statistical analysis conducted on geographies consisting of 377,282,938 people shows no correlation between the proportion of Immigrants from Guatemala and percentage of population with at least 2nd grade education in the United States with a correlation coefficient (R) of -0.028 and weighted average of 96.2%, a difference of 2.1%.
Delaware vs Immigrants from Guatemala 2nd Grade

2nd Grade Correlation Summary

MeasurementDelawareImmigrants from Guatemala
Minimum92.6%87.5%
Maximum100.0%100.0%
Range7.4%12.5%
Mean98.6%94.8%
Median99.0%95.0%
Interquartile 25% (IQ1)98.2%92.8%
Interquartile 75% (IQ3)99.7%96.1%
Interquartile Range (IQR)1.5%3.3%
Standard Deviation (Sample)1.5%2.9%
Standard Deviation (Population)1.5%2.8%

Similar Demographics by 2nd Grade

Demographics Similar to Delaware by 2nd Grade

In terms of 2nd grade, the demographic groups most similar to Delaware are Immigrants from Sweden (98.2%, a difference of 0.0%), Hopi (98.2%, a difference of 0.0%), Potawatomi (98.2%, a difference of 0.0%), Immigrants from Lithuania (98.2%, a difference of 0.010%), and Immigrants from Belgium (98.2%, a difference of 0.010%).
DemographicsRating | Rank2nd Grade
Shoshone
99.4
/100
|
#75
Exceptional
98.3%
Cherokee
99.4
/100
|
#76
Exceptional
98.3%
Immigrants | England
99.4
/100
|
#77
Exceptional
98.3%
Immigrants | Lithuania
99.3
/100
|
#78
Exceptional
98.2%
Immigrants | Belgium
99.3
/100
|
#79
Exceptional
98.2%
Osage
99.2
/100
|
#80
Exceptional
98.2%
Icelanders
99.2
/100
|
#81
Exceptional
98.2%
Delaware
99.1
/100
|
#82
Exceptional
98.2%
Immigrants | Sweden
99.1
/100
|
#83
Exceptional
98.2%
Hopi
99.1
/100
|
#84
Exceptional
98.2%
Potawatomi
99.1
/100
|
#85
Exceptional
98.2%
Immigrants | Australia
99.0
/100
|
#86
Exceptional
98.2%
Immigrants | Denmark
99.0
/100
|
#87
Exceptional
98.2%
Macedonians
99.0
/100
|
#88
Exceptional
98.2%
Ukrainians
98.9
/100
|
#89
Exceptional
98.2%

Demographics Similar to Immigrants from Guatemala by 2nd Grade

In terms of 2nd grade, the demographic groups most similar to Immigrants from Guatemala are Immigrants from Central America (96.2%, a difference of 0.010%), Immigrants from Mexico (96.1%, a difference of 0.040%), Nepalese (96.1%, a difference of 0.13%), Guatemalan (96.3%, a difference of 0.14%), and Salvadoran (96.0%, a difference of 0.16%).
DemographicsRating | Rank2nd Grade
Immigrants | Dominican Republic
0.0
/100
|
#333
Tragic
96.4%
Central Americans
0.0
/100
|
#334
Tragic
96.4%
Yakama
0.0
/100
|
#335
Tragic
96.4%
Immigrants | Fiji
0.0
/100
|
#336
Tragic
96.4%
Immigrants | Cambodia
0.0
/100
|
#337
Tragic
96.4%
Immigrants | Cabo Verde
0.0
/100
|
#338
Tragic
96.3%
Guatemalans
0.0
/100
|
#339
Tragic
96.3%
Immigrants | Guatemala
0.0
/100
|
#340
Tragic
96.2%
Immigrants | Central America
0.0
/100
|
#341
Tragic
96.2%
Immigrants | Mexico
0.0
/100
|
#342
Tragic
96.1%
Nepalese
0.0
/100
|
#343
Tragic
96.1%
Salvadorans
0.0
/100
|
#344
Tragic
96.0%
Immigrants | El Salvador
0.0
/100
|
#345
Tragic
95.9%
Immigrants | Yemen
0.0
/100
|
#346
Tragic
95.7%
Spanish American Indians
0.0
/100
|
#347
Tragic
95.6%