Delaware vs Immigrants from Ethiopia Bachelor's Degree

COMPARE

Delaware
Race
Ancestry
AfghanAfricanAlaska NativeAlaskan AthabascanAlbanianAleutAlsatianAmericanApacheArabArapahoArgentineanArmenianAssyrian/Chaldean/SyriacAustralianAustrianBahamianBangladeshiBarbadianBasqueBelgianBelizeanBermudanBhutaneseBlackfeetBolivianBrazilianBritishBritish West IndianBulgarianBurmeseCajunCambodianCanadianCape VerdeanCarpatho RusynCelticCentral AmericanCentral American IndianCherokeeCheyenneChickasawChileanChineseChippewaChoctawColombianColvilleComancheCosta RicanCreeCreekCroatianCrowCubanCypriotCzechCzechoslovakianDanishDelawareDominicanDutchDutch West IndianEastern EuropeanEcuadorianEgyptianEnglishEstonianEthiopianEuropeanFijianFilipinoFinnishFrenchFrench American IndianFrench CanadianGermanGerman RussianGhanaianGreekGuamanian/ChamorroGuatemalanGuyaneseHaitianHmongHonduranHopiHoumaHungarianIcelanderIndian (Asian)IndonesianInupiatIranianIraqiIrishIroquoisIsraeliItalianJamaicanJapaneseJordanianKenyanKiowaKoreanLaotianLatvianLebaneseLiberianLithuanianLumbeeLuxembourgerMacedonianMalaysianMalteseMarshalleseMenomineeMexicanMexican American IndianMongolianMoroccanNative HawaiianNavajoNepaleseNew ZealanderNicaraguanNigerianNorthern EuropeanNorwegianOkinawanOsageOttawaPaiutePakistaniPalestinianPanamanianParaguayanPennsylvania GermanPeruvianPimaPolishPortuguesePotawatomiPuebloPuerto RicanPuget Sound SalishRomanianRussianSalvadoranSamoanScandinavianScotch-IrishScottishSeminoleSenegaleseSerbianShoshoneSierra LeoneanSiouxSlavicSlovakSloveneSomaliSouth AfricanSouth AmericanSouth American IndianSoviet UnionSpaniardSpanishSpanish AmericanSpanish American IndianSri LankanSubsaharan AfricanSudaneseSwedishSwissSyrianTaiwaneseThaiTlingit-HaidaTohono O'OdhamTonganTrinidadian and TobagonianTsimshianTurkishU.S. Virgin IslanderUgandanUkrainianUruguayanUteVenezuelanVietnameseWelshWest IndianYakamaYaquiYugoslavianYumanYup'ikZimbabwean
Immigration
NonimmigrantsImmigrantsAfghanistanAfricaAlbaniaArgentinaArmeniaAsiaAustraliaAustriaBahamasBangladeshBarbadosBelarusBelgiumBelizeBoliviaBosnia and HerzegovinaBrazilBulgariaBurma/MyanmarCabo VerdeCambodiaCameroonCanadaCaribbeanCentral AmericaChileChinaColombiaCongoCosta RicaCroatiaCubaCzechoslovakiaDenmarkDominicaDominican RepublicEastern AfricaEastern AsiaEastern EuropeEcuadorEgyptEl SalvadorEnglandEritreaEuropeFijiFranceGermanyGhanaGreeceGrenadaGuatemalaGuyanaHaitiHondurasHong KongHungaryIndiaIndonesiaIranIraqIrelandIsraelItalyJamaicaJapanJordanKazakhstanKenyaKoreaKuwaitLaosLatin AmericaLatviaLebanonLiberiaLithuaniaMalaysiaMexicoMicronesiaMiddle AfricaMoldovaMoroccoNepalNetherlandsNicaraguaNigeriaNorth AmericaNorth MacedoniaNorthern AfricaNorthern EuropeNorwayOceaniaPakistanPanamaPeruPhilippinesPolandPortugalRomaniaRussiaSaudi ArabiaScotlandSenegalSerbiaSierra LeoneSingaporeSomaliaSouth AfricaSouth AmericaSouth Central AsiaSouth Eastern AsiaSouthern EuropeSpainSri LankaSt. Vincent and the GrenadinesSudanSwedenSwitzerlandSyriaTaiwanThailandTrinidad and TobagoTurkeyUgandaUkraineUruguayUzbekistanVenezuelaVietnamWest IndiesWestern AfricaWestern AsiaWestern EuropeYemenZaireZimbabweAzores
Immigrants from Ethiopia
Race
Ancestry
AfghanAfricanAlaska NativeAlaskan AthabascanAlbanianAleutAlsatianAmericanApacheArabArapahoArgentineanArmenianAssyrian/Chaldean/SyriacAustralianAustrianBahamianBangladeshiBarbadianBasqueBelgianBelizeanBermudanBhutaneseBlackfeetBolivianBrazilianBritishBritish West IndianBulgarianBurmeseCajunCambodianCanadianCape VerdeanCarpatho RusynCelticCentral AmericanCentral American IndianCherokeeCheyenneChickasawChileanChineseChippewaChoctawColombianColvilleComancheCosta RicanCreeCreekCroatianCrowCubanCypriotCzechCzechoslovakianDanishDominicanDutchDutch West IndianEastern EuropeanEcuadorianEgyptianEnglishEstonianEthiopianEuropeanFijianFilipinoFinnishFrenchFrench American IndianFrench CanadianGermanGerman RussianGhanaianGreekGuamanian/ChamorroGuatemalanGuyaneseHaitianHmongHonduranHopiHoumaHungarianIcelanderIndian (Asian)IndonesianInupiatIranianIraqiIrishIroquoisIsraeliItalianJamaicanJapaneseJordanianKenyanKiowaKoreanLaotianLatvianLebaneseLiberianLithuanianLumbeeLuxembourgerMacedonianMalaysianMalteseMarshalleseMenomineeMexicanMexican American IndianMongolianMoroccanNative HawaiianNavajoNepaleseNew ZealanderNicaraguanNigerianNorthern EuropeanNorwegianOkinawanOsageOttawaPaiutePakistaniPalestinianPanamanianParaguayanPennsylvania GermanPeruvianPimaPolishPortuguesePotawatomiPuebloPuerto RicanPuget Sound SalishRomanianRussianSalvadoranSamoanScandinavianScotch-IrishScottishSeminoleSenegaleseSerbianShoshoneSierra LeoneanSiouxSlavicSlovakSloveneSomaliSouth AfricanSouth AmericanSouth American IndianSoviet UnionSpaniardSpanishSpanish AmericanSpanish American IndianSri LankanSubsaharan AfricanSudaneseSwedishSwissSyrianTaiwaneseThaiTlingit-HaidaTohono O'OdhamTonganTrinidadian and TobagonianTsimshianTurkishU.S. Virgin IslanderUgandanUkrainianUruguayanUteVenezuelanVietnameseWelshWest IndianYakamaYaquiYugoslavianYumanYup'ikZimbabwean
Immigration
NonimmigrantsImmigrantsAfghanistanAfricaAlbaniaArgentinaArmeniaAsiaAustraliaAustriaBahamasBangladeshBarbadosBelarusBelgiumBelizeBoliviaBosnia and HerzegovinaBrazilBulgariaBurma/MyanmarCabo VerdeCambodiaCameroonCanadaCaribbeanCentral AmericaChileChinaColombiaCongoCosta RicaCroatiaCubaCzechoslovakiaDenmarkDominicaDominican RepublicEastern AfricaEastern AsiaEastern EuropeEcuadorEgyptEl SalvadorEnglandEritreaEthiopiaEuropeFijiFranceGermanyGhanaGreeceGrenadaGuatemalaGuyanaHaitiHondurasHong KongHungaryIndiaIndonesiaIranIraqIrelandIsraelItalyJamaicaJapanJordanKazakhstanKenyaKoreaKuwaitLaosLatin AmericaLatviaLebanonLiberiaLithuaniaMalaysiaMexicoMicronesiaMiddle AfricaMoldovaMoroccoNepalNetherlandsNicaraguaNigeriaNorth AmericaNorth MacedoniaNorthern AfricaNorthern EuropeNorwayOceaniaPakistanPanamaPeruPhilippinesPolandPortugalRomaniaRussiaSaudi ArabiaScotlandSenegalSerbiaSierra LeoneSingaporeSomaliaSouth AfricaSouth AmericaSouth Central AsiaSouth Eastern AsiaSouthern EuropeSpainSri LankaSt. Vincent and the GrenadinesSudanSwedenSwitzerlandSyriaTaiwanThailandTrinidad and TobagoTurkeyUgandaUkraineUruguayUzbekistanVenezuelaVietnamWest IndiesWestern AfricaWestern AsiaWestern EuropeYemenZaireZimbabweAzores
Bachelor's Degree
Income
Poverty
Unemployment
Labor Participation
Family Structure
Vehicle Availability
Education Level
Disability

Bachelor's Degree Comparison

Delaware

Immigrants from Ethiopia

Tragic
Exceptional
33.8%
BACHELOR'S DEGREE
1.2/ 100
METRIC RATING
244th/ 347
METRIC RANK
42.5%
BACHELOR'S DEGREE
99.4/ 100
METRIC RATING
78th/ 347
METRIC RANK

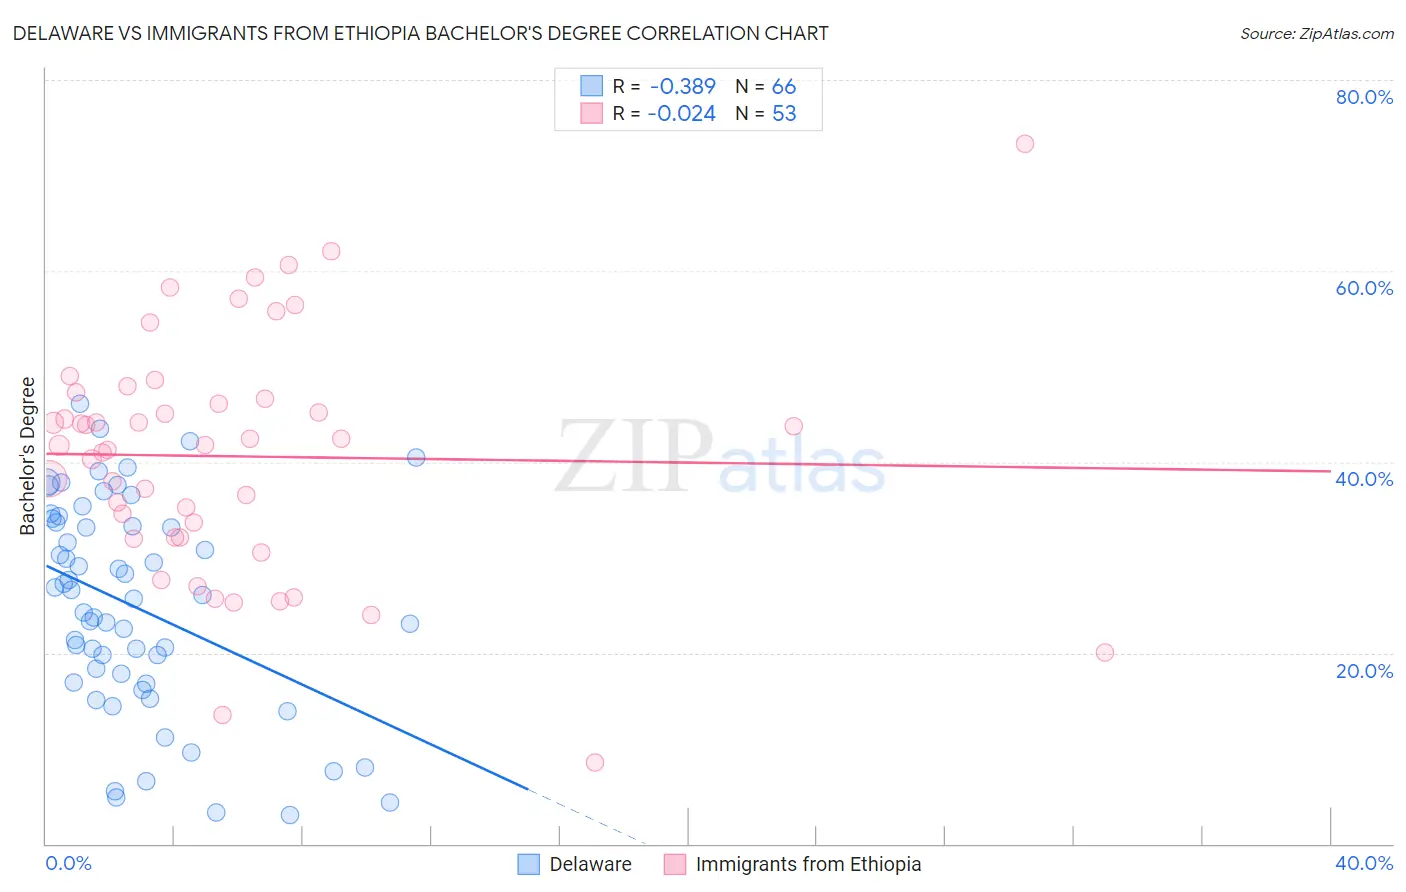
Delaware vs Immigrants from Ethiopia Bachelor's Degree Correlation Chart

The statistical analysis conducted on geographies consisting of 96,234,889 people shows a mild negative correlation between the proportion of Delaware and percentage of population with at least bachelor's degree education in the United States with a correlation coefficient (R) of -0.389 and weighted average of 33.8%. Similarly, the statistical analysis conducted on geographies consisting of 211,546,293 people shows no correlation between the proportion of Immigrants from Ethiopia and percentage of population with at least bachelor's degree education in the United States with a correlation coefficient (R) of -0.024 and weighted average of 42.5%, a difference of 25.8%.
Delaware vs Immigrants from Ethiopia Bachelor's Degree

Bachelor's Degree Correlation Summary

MeasurementDelawareImmigrants from Ethiopia
Minimum3.0%8.6%
Maximum46.1%73.3%
Range43.0%64.8%
Mean24.8%40.6%
Median25.8%41.8%
Interquartile 25% (IQ1)16.9%32.1%
Interquartile 75% (IQ3)33.6%46.9%
Interquartile Range (IQR)16.7%14.8%
Standard Deviation (Sample)11.0%12.6%
Standard Deviation (Population)11.0%12.4%

Similar Demographics by Bachelor's Degree

Demographics Similar to Delaware by Bachelor's Degree

In terms of bachelor's degree, the demographic groups most similar to Delaware are Immigrants from Fiji (33.7%, a difference of 0.090%), Jamaican (33.6%, a difference of 0.45%), Immigrants from Guyana (33.9%, a difference of 0.50%), Immigrants from Congo (33.6%, a difference of 0.54%), and Cree (33.6%, a difference of 0.56%).
DemographicsRating | RankBachelor's Degree
Tlingit-Haida
2.8
/100
|
#237
Tragic
34.6%
Guyanese
2.5
/100
|
#238
Tragic
34.5%
British West Indians
2.5
/100
|
#239
Tragic
34.5%
Tongans
2.0
/100
|
#240
Tragic
34.3%
Immigrants | Cambodia
1.9
/100
|
#241
Tragic
34.2%
Immigrants | Nonimmigrants
1.8
/100
|
#242
Tragic
34.2%
Immigrants | Guyana
1.4
/100
|
#243
Tragic
33.9%
Delaware
1.2
/100
|
#244
Tragic
33.8%
Immigrants | Fiji
1.2
/100
|
#245
Tragic
33.7%
Jamaicans
1.0
/100
|
#246
Tragic
33.6%
Immigrants | Congo
1.0
/100
|
#247
Tragic
33.6%
Cree
1.0
/100
|
#248
Tragic
33.6%
Immigrants | Liberia
0.9
/100
|
#249
Tragic
33.5%
Indonesians
0.9
/100
|
#250
Tragic
33.5%
Japanese
0.7
/100
|
#251
Tragic
33.3%

Demographics Similar to Immigrants from Ethiopia by Bachelor's Degree

In terms of bachelor's degree, the demographic groups most similar to Immigrants from Ethiopia are Immigrants from Eastern Europe (42.5%, a difference of 0.060%), Immigrants from Lebanon (42.4%, a difference of 0.17%), Immigrants from Egypt (42.6%, a difference of 0.24%), Immigrants from Zimbabwe (42.6%, a difference of 0.26%), and Immigrants from Croatia (42.3%, a difference of 0.36%).
DemographicsRating | RankBachelor's Degree
Immigrants | Argentina
99.6
/100
|
#71
Exceptional
42.8%
Ethiopians
99.5
/100
|
#72
Exceptional
42.8%
Immigrants | Uzbekistan
99.5
/100
|
#73
Exceptional
42.8%
Bhutanese
99.5
/100
|
#74
Exceptional
42.7%
Immigrants | Zimbabwe
99.4
/100
|
#75
Exceptional
42.6%
Immigrants | Egypt
99.4
/100
|
#76
Exceptional
42.6%
Immigrants | Eastern Europe
99.4
/100
|
#77
Exceptional
42.5%
Immigrants | Ethiopia
99.4
/100
|
#78
Exceptional
42.5%
Immigrants | Lebanon
99.3
/100
|
#79
Exceptional
42.4%
Immigrants | Croatia
99.2
/100
|
#80
Exceptional
42.3%
Immigrants | Hungary
99.2
/100
|
#81
Exceptional
42.3%
Immigrants | Scotland
99.2
/100
|
#82
Exceptional
42.3%
Armenians
99.2
/100
|
#83
Exceptional
42.3%
Immigrants | Western Asia
99.2
/100
|
#84
Exceptional
42.3%
Lithuanians
99.2
/100
|
#85
Exceptional
42.2%