Danish vs Immigrants from Peru Bachelor's Degree
COMPARE
Danish
Immigrants from Peru
Bachelor's Degree
Bachelor's Degree Comparison
Danes
Immigrants from Peru
38.1%
BACHELOR'S DEGREE
56.2/ 100
METRIC RATING
168th/ 347
METRIC RANK
37.5%
BACHELOR'S DEGREE
41.3/ 100
METRIC RATING
185th/ 347
METRIC RANK
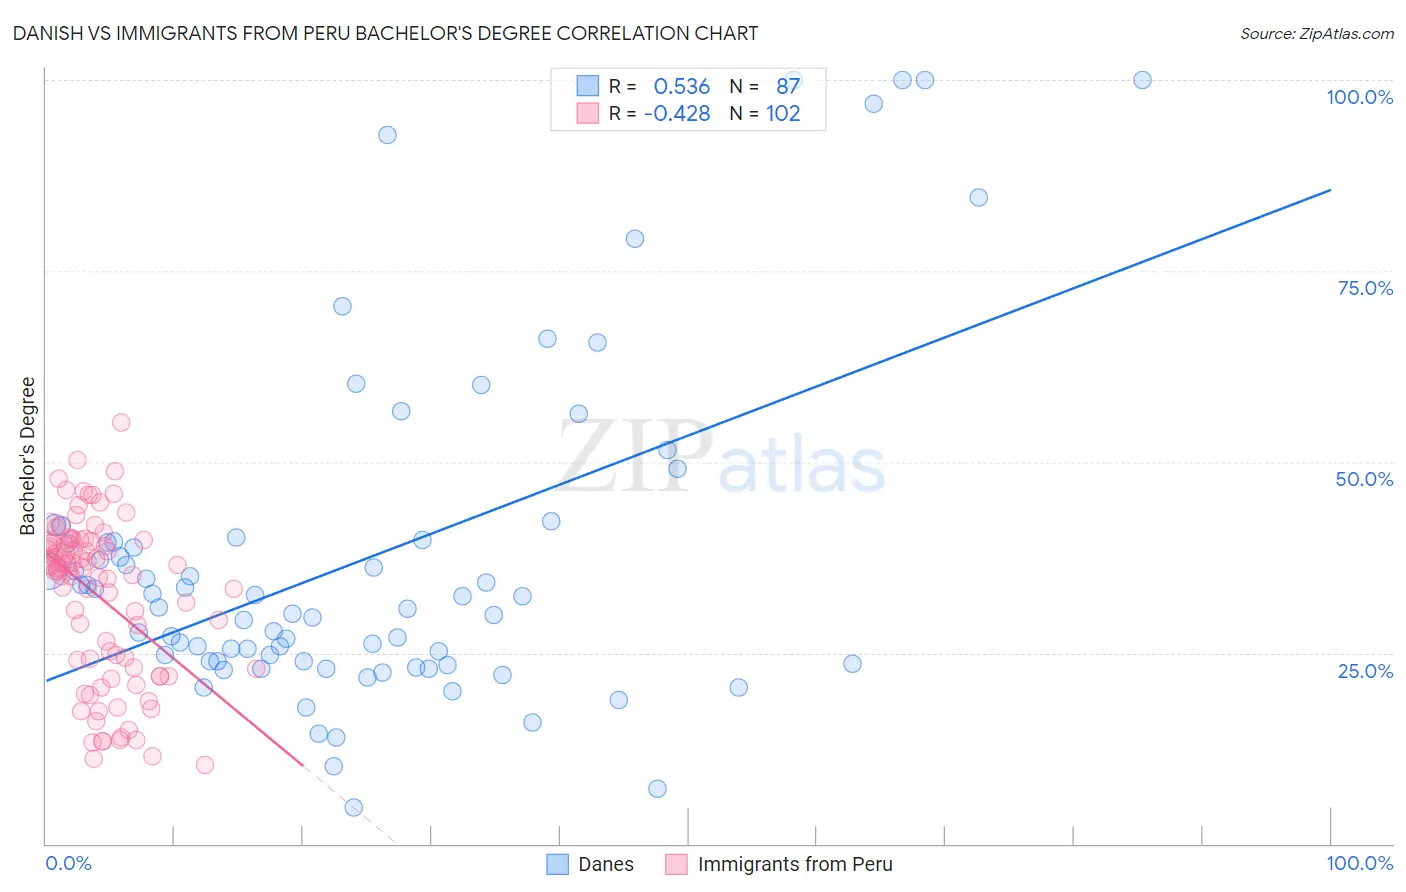
Danish vs Immigrants from Peru Bachelor's Degree Correlation Chart
The statistical analysis conducted on geographies consisting of 474,149,841 people shows a substantial positive correlation between the proportion of Danes and percentage of population with at least bachelor's degree education in the United States with a correlation coefficient (R) of 0.536 and weighted average of 38.1%. Similarly, the statistical analysis conducted on geographies consisting of 328,855,740 people shows a moderate negative correlation between the proportion of Immigrants from Peru and percentage of population with at least bachelor's degree education in the United States with a correlation coefficient (R) of -0.428 and weighted average of 37.5%, a difference of 1.5%.
Bachelor's Degree Correlation Summary
| Measurement | Danish | Immigrants from Peru |
| Minimum | 4.8% | 10.3% |
| Maximum | 100.0% | 55.2% |
| Range | 95.2% | 44.9% |
| Mean | 37.4% | 32.4% |
| Median | 31.0% | 36.1% |
| Interquartile 25% (IQ1) | 23.9% | 23.0% |
| Interquartile 75% (IQ3) | 39.8% | 39.5% |
| Interquartile Range (IQR) | 15.9% | 16.5% |
| Standard Deviation (Sample) | 22.1% | 10.6% |
| Standard Deviation (Population) | 22.0% | 10.5% |
Demographics Similar to Danes and Immigrants from Peru by Bachelor's Degree
In terms of bachelor's degree, the demographic groups most similar to Danes are Scottish (38.1%, a difference of 0.030%), Ghanaian (38.0%, a difference of 0.090%), Czech (38.0%, a difference of 0.18%), Bermudan (38.0%, a difference of 0.20%), and Somali (38.1%, a difference of 0.24%). Similarly, the demographic groups most similar to Immigrants from Peru are Scandinavian (37.5%, a difference of 0.040%), Senegalese (37.5%, a difference of 0.080%), Norwegian (37.5%, a difference of 0.10%), Immigrants from Bosnia and Herzegovina (37.6%, a difference of 0.21%), and Immigrants from Senegal (37.6%, a difference of 0.25%).
| Demographics | Rating | Rank | Bachelor's Degree |
| Somalis | 58.6 /100 | #166 | Average 38.1% |
| Scottish | 56.6 /100 | #167 | Average 38.1% |
| Danes | 56.2 /100 | #168 | Average 38.1% |
| Ghanaians | 55.3 /100 | #169 | Average 38.0% |
| Czechs | 54.4 /100 | #170 | Average 38.0% |
| Bermudans | 54.2 /100 | #171 | Average 38.0% |
| Immigrants | Somalia | 52.8 /100 | #172 | Average 37.9% |
| Immigrants | Iraq | 52.5 /100 | #173 | Average 37.9% |
| Immigrants | Bangladesh | 50.0 /100 | #174 | Average 37.8% |
| Immigrants | Uruguay | 48.3 /100 | #175 | Average 37.8% |
| Costa Ricans | 47.6 /100 | #176 | Average 37.7% |
| Basques | 47.4 /100 | #177 | Average 37.7% |
| Immigrants | Cameroon | 46.8 /100 | #178 | Average 37.7% |
| Immigrants | Colombia | 45.4 /100 | #179 | Average 37.7% |
| Irish | 44.3 /100 | #180 | Average 37.6% |
| Immigrants | Senegal | 43.8 /100 | #181 | Average 37.6% |
| Immigrants | Bosnia and Herzegovina | 43.4 /100 | #182 | Average 37.6% |
| Senegalese | 42.2 /100 | #183 | Average 37.5% |
| Scandinavians | 41.7 /100 | #184 | Average 37.5% |
| Immigrants | Peru | 41.3 /100 | #185 | Average 37.5% |
| Norwegians | 40.4 /100 | #186 | Average 37.5% |