Crow vs Sierra Leonean Nursery School
COMPARE
Crow
Sierra Leonean
Nursery School
Nursery School Comparison
Crow
Sierra Leoneans
99.7%
NURSERY SCHOOL
100.0/ 100
METRIC RATING
1st/ 347
METRIC RANK
97.7%
NURSERY SCHOOL
2.9/ 100
METRIC RATING
230th/ 347
METRIC RANK
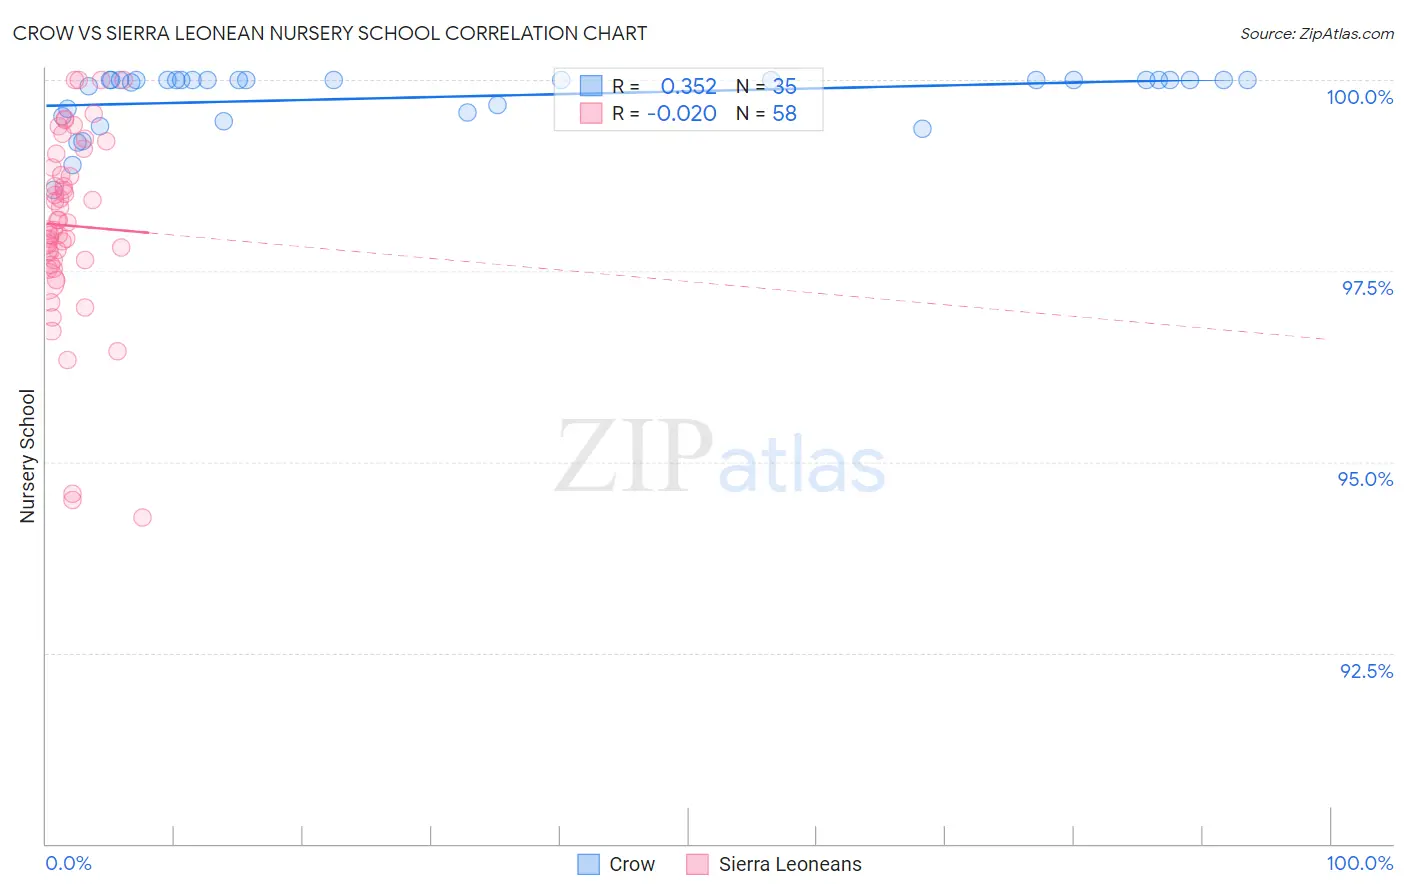
Crow vs Sierra Leonean Nursery School Correlation Chart
The statistical analysis conducted on geographies consisting of 665,246 people shows a mild positive correlation between the proportion of Crow and percentage of population with at least nursery school education in the United States with a correlation coefficient (R) of 0.352 and weighted average of 99.7%. Similarly, the statistical analysis conducted on geographies consisting of 83,337,655 people shows no correlation between the proportion of Sierra Leoneans and percentage of population with at least nursery school education in the United States with a correlation coefficient (R) of -0.020 and weighted average of 97.7%, a difference of 2.0%.
Nursery School Correlation Summary
| Measurement | Crow | Sierra Leonean |
| Minimum | 98.6% | 94.3% |
| Maximum | 100.0% | 100.0% |
| Range | 1.4% | 5.7% |
| Mean | 99.8% | 98.1% |
| Median | 100.0% | 98.1% |
| Interquartile 25% (IQ1) | 99.6% | 97.6% |
| Interquartile 75% (IQ3) | 100.0% | 98.9% |
| Interquartile Range (IQR) | 0.43% | 1.2% |
| Standard Deviation (Sample) | 0.37% | 1.2% |
| Standard Deviation (Population) | 0.36% | 1.2% |
Similar Demographics by Nursery School
Demographics Similar to Crow by Nursery School
In terms of nursery school, the demographic groups most similar to Crow are Yup'ik (99.2%, a difference of 0.44%), Welsh (98.9%, a difference of 0.77%), Inupiat (98.9%, a difference of 0.77%), Tsimshian (98.9%, a difference of 0.80%), and Alaskan Athabascan (98.8%, a difference of 0.87%).
| Demographics | Rating | Rank | Nursery School |
| Crow | 100.0 /100 | #1 | Exceptional 99.7% |
| Yup'ik | 100.0 /100 | #2 | Exceptional 99.2% |
| Welsh | 100.0 /100 | #3 | Exceptional 98.9% |
| Inupiat | 100.0 /100 | #4 | Exceptional 98.9% |
| Tsimshian | 100.0 /100 | #5 | Exceptional 98.9% |
| Alaskan Athabascans | 100.0 /100 | #6 | Exceptional 98.8% |
| Alaska Natives | 100.0 /100 | #7 | Exceptional 98.8% |
| Norwegians | 100.0 /100 | #8 | Exceptional 98.7% |
| Slovaks | 100.0 /100 | #9 | Exceptional 98.7% |
| Germans | 100.0 /100 | #10 | Exceptional 98.7% |
| Tlingit-Haida | 100.0 /100 | #11 | Exceptional 98.7% |
| Slovenes | 100.0 /100 | #12 | Exceptional 98.7% |
| English | 100.0 /100 | #13 | Exceptional 98.7% |
| Carpatho Rusyns | 100.0 /100 | #14 | Exceptional 98.7% |
| Swedes | 100.0 /100 | #15 | Exceptional 98.7% |
Demographics Similar to Sierra Leoneans by Nursery School
In terms of nursery school, the demographic groups most similar to Sierra Leoneans are Immigrants from Costa Rica (97.7%, a difference of 0.010%), Iraqi (97.7%, a difference of 0.010%), Subsaharan African (97.7%, a difference of 0.010%), Sudanese (97.7%, a difference of 0.010%), and Senegalese (97.7%, a difference of 0.010%).
| Demographics | Rating | Rank | Nursery School |
| Immigrants | Sudan | 3.9 /100 | #223 | Tragic 97.7% |
| Immigrants | Nepal | 3.6 /100 | #224 | Tragic 97.7% |
| Immigrants | Costa Rica | 3.5 /100 | #225 | Tragic 97.7% |
| Iraqis | 3.5 /100 | #226 | Tragic 97.7% |
| Sub-Saharan Africans | 3.2 /100 | #227 | Tragic 97.7% |
| Sudanese | 3.2 /100 | #228 | Tragic 97.7% |
| Senegalese | 3.2 /100 | #229 | Tragic 97.7% |
| Sierra Leoneans | 2.9 /100 | #230 | Tragic 97.7% |
| Puerto Ricans | 2.6 /100 | #231 | Tragic 97.7% |
| Immigrants | Uruguay | 2.3 /100 | #232 | Tragic 97.7% |
| U.S. Virgin Islanders | 2.1 /100 | #233 | Tragic 97.7% |
| Colombians | 2.1 /100 | #234 | Tragic 97.7% |
| Immigrants | Pakistan | 2.1 /100 | #235 | Tragic 97.7% |
| Immigrants | Malaysia | 1.9 /100 | #236 | Tragic 97.7% |
| Immigrants | Western Asia | 1.9 /100 | #237 | Tragic 97.7% |