Creek vs Polish 8th Grade

COMPARE

Creek
Race
Ancestry
AfghanAfricanAlaska NativeAlaskan AthabascanAlbanianAleutAlsatianAmericanApacheArabArapahoArgentineanArmenianAssyrian/Chaldean/SyriacAustralianAustrianBahamianBangladeshiBarbadianBasqueBelgianBelizeanBermudanBhutaneseBlackfeetBolivianBrazilianBritishBritish West IndianBulgarianBurmeseCajunCambodianCanadianCape VerdeanCarpatho RusynCelticCentral AmericanCentral American IndianCherokeeCheyenneChickasawChileanChineseChippewaChoctawColombianColvilleComancheCosta RicanCreeCreekCroatianCrowCubanCypriotCzechCzechoslovakianDanishDelawareDominicanDutchDutch West IndianEastern EuropeanEcuadorianEgyptianEnglishEstonianEthiopianEuropeanFijianFilipinoFinnishFrenchFrench American IndianFrench CanadianGermanGerman RussianGhanaianGreekGuamanian/ChamorroGuatemalanGuyaneseHaitianHmongHonduranHopiHoumaHungarianIcelanderIndian (Asian)IndonesianInupiatIranianIraqiIrishIroquoisIsraeliItalianJamaicanJapaneseJordanianKenyanKiowaKoreanLaotianLatvianLebaneseLiberianLithuanianLumbeeLuxembourgerMacedonianMalaysianMalteseMarshalleseMenomineeMexicanMexican American IndianMongolianMoroccanNative HawaiianNavajoNepaleseNew ZealanderNicaraguanNigerianNorthern EuropeanNorwegianOkinawanOsageOttawaPaiutePakistaniPalestinianPanamanianParaguayanPennsylvania GermanPeruvianPimaPortuguesePotawatomiPuebloPuerto RicanPuget Sound SalishRomanianRussianSalvadoranSamoanScandinavianScotch-IrishScottishSeminoleSenegaleseSerbianShoshoneSierra LeoneanSiouxSlavicSlovakSloveneSomaliSouth AfricanSouth AmericanSouth American IndianSoviet UnionSpaniardSpanishSpanish AmericanSpanish American IndianSri LankanSubsaharan AfricanSudaneseSwedishSwissSyrianTaiwaneseThaiTlingit-HaidaTohono O'OdhamTonganTrinidadian and TobagonianTsimshianTurkishU.S. Virgin IslanderUgandanUkrainianUruguayanUteVenezuelanVietnameseWelshWest IndianYakamaYaquiYugoslavianYumanYup'ikZimbabwean
Immigration
NonimmigrantsImmigrantsAfghanistanAfricaAlbaniaArgentinaArmeniaAsiaAustraliaAustriaBahamasBangladeshBarbadosBelarusBelgiumBelizeBoliviaBosnia and HerzegovinaBrazilBulgariaBurma/MyanmarCabo VerdeCambodiaCameroonCanadaCaribbeanCentral AmericaChileChinaColombiaCongoCosta RicaCroatiaCubaCzechoslovakiaDenmarkDominicaDominican RepublicEastern AfricaEastern AsiaEastern EuropeEcuadorEgyptEl SalvadorEnglandEritreaEthiopiaEuropeFijiFranceGermanyGhanaGreeceGrenadaGuatemalaGuyanaHaitiHondurasHong KongHungaryIndiaIndonesiaIranIraqIrelandIsraelItalyJamaicaJapanJordanKazakhstanKenyaKoreaKuwaitLaosLatin AmericaLatviaLebanonLiberiaLithuaniaMalaysiaMexicoMicronesiaMiddle AfricaMoldovaMoroccoNepalNetherlandsNicaraguaNigeriaNorth AmericaNorth MacedoniaNorthern AfricaNorthern EuropeNorwayOceaniaPakistanPanamaPeruPhilippinesPolandPortugalRomaniaRussiaSaudi ArabiaScotlandSenegalSerbiaSierra LeoneSingaporeSomaliaSouth AfricaSouth AmericaSouth Central AsiaSouth Eastern AsiaSouthern EuropeSpainSri LankaSt. Vincent and the GrenadinesSudanSwedenSwitzerlandSyriaTaiwanThailandTrinidad and TobagoTurkeyUgandaUkraineUruguayUzbekistanVenezuelaVietnamWest IndiesWestern AfricaWestern AsiaWestern EuropeYemenZaireZimbabweAzores
Polish
Race
Ancestry
AfghanAfricanAlaska NativeAlaskan AthabascanAlbanianAleutAlsatianAmericanApacheArabArapahoArgentineanArmenianAssyrian/Chaldean/SyriacAustralianAustrianBahamianBangladeshiBarbadianBasqueBelgianBelizeanBermudanBhutaneseBlackfeetBolivianBrazilianBritishBritish West IndianBulgarianBurmeseCajunCambodianCanadianCape VerdeanCarpatho RusynCelticCentral AmericanCentral American IndianCherokeeCheyenneChickasawChileanChineseChippewaChoctawColombianColvilleComancheCosta RicanCreeCroatianCrowCubanCypriotCzechCzechoslovakianDanishDelawareDominicanDutchDutch West IndianEastern EuropeanEcuadorianEgyptianEnglishEstonianEthiopianEuropeanFijianFilipinoFinnishFrenchFrench American IndianFrench CanadianGermanGerman RussianGhanaianGreekGuamanian/ChamorroGuatemalanGuyaneseHaitianHmongHonduranHopiHoumaHungarianIcelanderIndian (Asian)IndonesianInupiatIranianIraqiIrishIroquoisIsraeliItalianJamaicanJapaneseJordanianKenyanKiowaKoreanLaotianLatvianLebaneseLiberianLithuanianLumbeeLuxembourgerMacedonianMalaysianMalteseMarshalleseMenomineeMexicanMexican American IndianMongolianMoroccanNative HawaiianNavajoNepaleseNew ZealanderNicaraguanNigerianNorthern EuropeanNorwegianOkinawanOsageOttawaPaiutePakistaniPalestinianPanamanianParaguayanPennsylvania GermanPeruvianPimaPolishPortuguesePotawatomiPuebloPuerto RicanPuget Sound SalishRomanianRussianSalvadoranSamoanScandinavianScotch-IrishScottishSeminoleSenegaleseSerbianShoshoneSierra LeoneanSiouxSlavicSlovakSloveneSomaliSouth AfricanSouth AmericanSouth American IndianSoviet UnionSpaniardSpanishSpanish AmericanSpanish American IndianSri LankanSubsaharan AfricanSudaneseSwedishSwissSyrianTaiwaneseThaiTlingit-HaidaTohono O'OdhamTonganTrinidadian and TobagonianTsimshianTurkishU.S. Virgin IslanderUgandanUkrainianUruguayanUteVenezuelanVietnameseWelshWest IndianYakamaYaquiYugoslavianYumanYup'ikZimbabwean
Immigration
NonimmigrantsImmigrantsAfghanistanAfricaAlbaniaArgentinaArmeniaAsiaAustraliaAustriaBahamasBangladeshBarbadosBelarusBelgiumBelizeBoliviaBosnia and HerzegovinaBrazilBulgariaBurma/MyanmarCabo VerdeCambodiaCameroonCanadaCaribbeanCentral AmericaChileChinaColombiaCongoCosta RicaCroatiaCubaCzechoslovakiaDenmarkDominicaDominican RepublicEastern AfricaEastern AsiaEastern EuropeEcuadorEgyptEl SalvadorEnglandEritreaEthiopiaEuropeFijiFranceGermanyGhanaGreeceGrenadaGuatemalaGuyanaHaitiHondurasHong KongHungaryIndiaIndonesiaIranIraqIrelandIsraelItalyJamaicaJapanJordanKazakhstanKenyaKoreaKuwaitLaosLatin AmericaLatviaLebanonLiberiaLithuaniaMalaysiaMexicoMicronesiaMiddle AfricaMoldovaMoroccoNepalNetherlandsNicaraguaNigeriaNorth AmericaNorth MacedoniaNorthern AfricaNorthern EuropeNorwayOceaniaPakistanPanamaPeruPhilippinesPolandPortugalRomaniaRussiaSaudi ArabiaScotlandSenegalSerbiaSierra LeoneSingaporeSomaliaSouth AfricaSouth AmericaSouth Central AsiaSouth Eastern AsiaSouthern EuropeSpainSri LankaSt. Vincent and the GrenadinesSudanSwedenSwitzerlandSyriaTaiwanThailandTrinidad and TobagoTurkeyUgandaUkraineUruguayUzbekistanVenezuelaVietnamWest IndiesWestern AfricaWestern AsiaWestern EuropeYemenZaireZimbabweAzores
8th Grade
Income
Poverty
Unemployment
Labor Participation
Family Structure
Vehicle Availability
Education Level
Disability

8th Grade Comparison

Creek

Poles

Exceptional
Exceptional
96.6%
8TH GRADE
99.7/ 100
METRIC RATING
68th/ 347
METRIC RANK
97.4%
8TH GRADE
100.0/ 100
METRIC RATING
11th/ 347
METRIC RANK

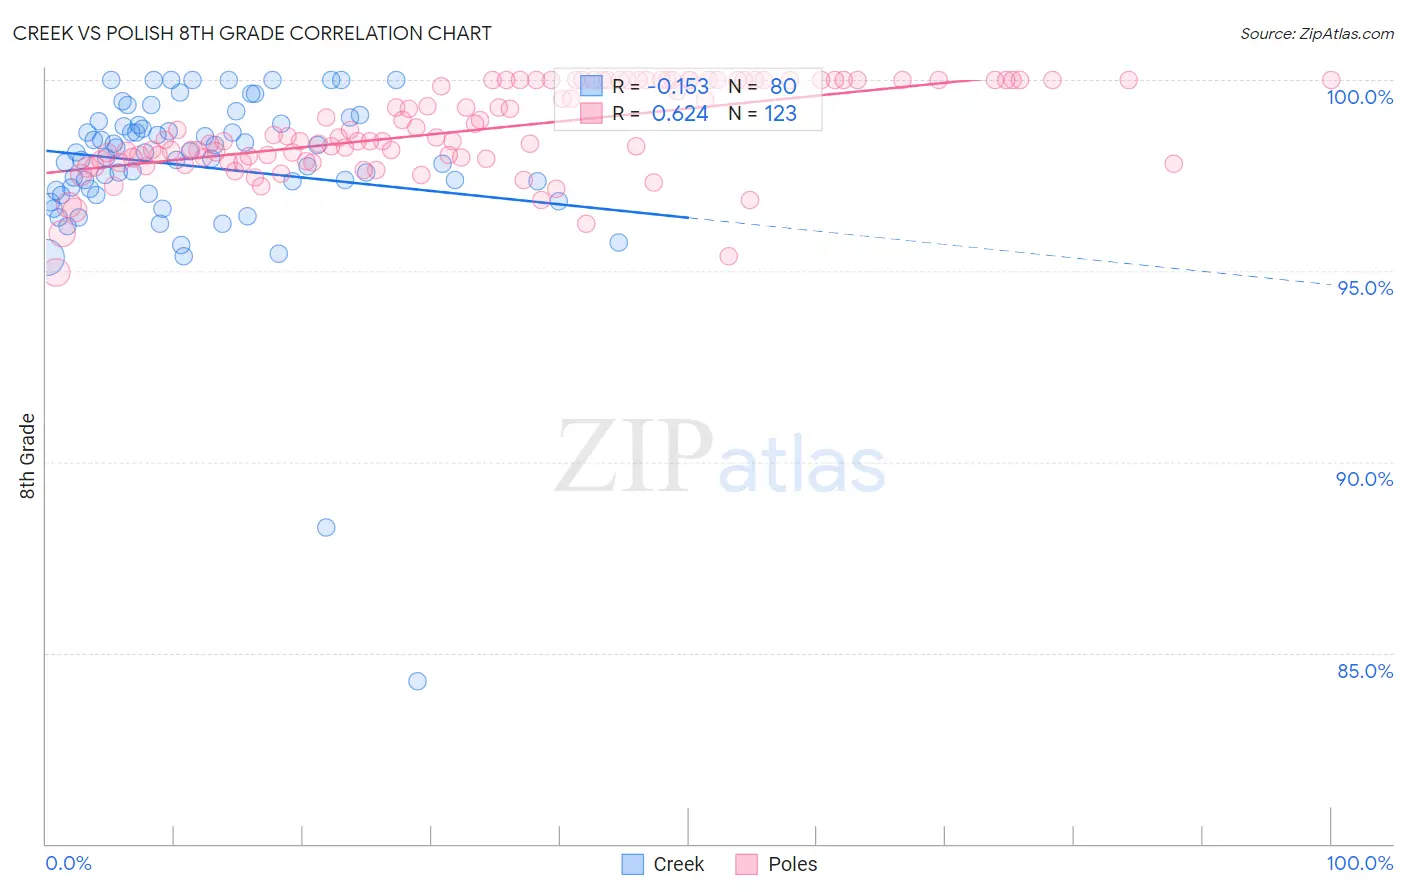
Creek vs Polish 8th Grade Correlation Chart

The statistical analysis conducted on geographies consisting of 178,480,629 people shows a poor negative correlation between the proportion of Creek and percentage of population with at least 8th grade education in the United States with a correlation coefficient (R) of -0.153 and weighted average of 96.6%. Similarly, the statistical analysis conducted on geographies consisting of 475,812,379 people shows a significant positive correlation between the proportion of Poles and percentage of population with at least 8th grade education in the United States with a correlation coefficient (R) of 0.624 and weighted average of 97.4%, a difference of 0.83%.
Creek vs Polish 8th Grade

8th Grade Correlation Summary

MeasurementCreekPolish
Minimum84.3%95.0%
Maximum100.0%100.0%
Range15.7%5.0%
Mean97.7%98.7%
Median98.0%98.4%
Interquartile 25% (IQ1)97.1%97.9%
Interquartile 75% (IQ3)98.8%100.0%
Interquartile Range (IQR)1.8%2.1%
Standard Deviation (Sample)2.3%1.2%
Standard Deviation (Population)2.2%1.2%

Similar Demographics by 8th Grade

Demographics Similar to Creek by 8th Grade

In terms of 8th grade, the demographic groups most similar to Creek are American (96.6%, a difference of 0.0%), Iranian (96.6%, a difference of 0.010%), Immigrants from India (96.6%, a difference of 0.020%), Native Hawaiian (96.6%, a difference of 0.020%), and Canadian (96.6%, a difference of 0.020%).
DemographicsRating | Rank8th Grade
Immigrants | Austria
99.8
/100
|
#61
Exceptional
96.7%
Whites/Caucasians
99.8
/100
|
#62
Exceptional
96.7%
Ukrainians
99.7
/100
|
#63
Exceptional
96.7%
Immigrants | India
99.7
/100
|
#64
Exceptional
96.6%
Native Hawaiians
99.7
/100
|
#65
Exceptional
96.6%
Canadians
99.7
/100
|
#66
Exceptional
96.6%
Iranians
99.7
/100
|
#67
Exceptional
96.6%
Creek
99.7
/100
|
#68
Exceptional
96.6%
Americans
99.7
/100
|
#69
Exceptional
96.6%
Immigrants | Lithuania
99.6
/100
|
#70
Exceptional
96.6%
New Zealanders
99.5
/100
|
#71
Exceptional
96.6%
Immigrants | England
99.5
/100
|
#72
Exceptional
96.6%
Arapaho
99.5
/100
|
#73
Exceptional
96.6%
Immigrants | Ireland
99.5
/100
|
#74
Exceptional
96.5%
Zimbabweans
99.4
/100
|
#75
Exceptional
96.5%

Demographics Similar to Poles by 8th Grade

In terms of 8th grade, the demographic groups most similar to Poles are Slovene (97.5%, a difference of 0.030%), Swedish (97.4%, a difference of 0.030%), Alaskan Athabascan (97.3%, a difference of 0.10%), English (97.3%, a difference of 0.10%), and German (97.5%, a difference of 0.11%).
DemographicsRating | Rank8th Grade
Carpatho Rusyns
100.0
/100
|
#4
Exceptional
98.1%
Ottawa
100.0
/100
|
#5
Exceptional
97.9%
Dutch
100.0
/100
|
#6
Exceptional
97.7%
Norwegians
100.0
/100
|
#7
Exceptional
97.6%
Slovaks
100.0
/100
|
#8
Exceptional
97.6%
Germans
100.0
/100
|
#9
Exceptional
97.5%
Slovenes
100.0
/100
|
#10
Exceptional
97.5%
Poles
100.0
/100
|
#11
Exceptional
97.4%
Swedes
100.0
/100
|
#12
Exceptional
97.4%
Alaskan Athabascans
100.0
/100
|
#13
Exceptional
97.3%
English
100.0
/100
|
#14
Exceptional
97.3%
Pennsylvania Germans
100.0
/100
|
#15
Exceptional
97.3%
Tlingit-Haida
100.0
/100
|
#16
Exceptional
97.3%
Irish
100.0
/100
|
#17
Exceptional
97.3%
Lithuanians
100.0
/100
|
#18
Exceptional
97.3%