Cree vs Immigrants from Spain 7th Grade
COMPARE
Cree
Immigrants from Spain
7th Grade
7th Grade Comparison
Cree
Immigrants from Spain
96.7%
7TH GRADE
99.0/ 100
METRIC RATING
89th/ 347
METRIC RANK
96.0%
7TH GRADE
38.8/ 100
METRIC RATING
183rd/ 347
METRIC RANK
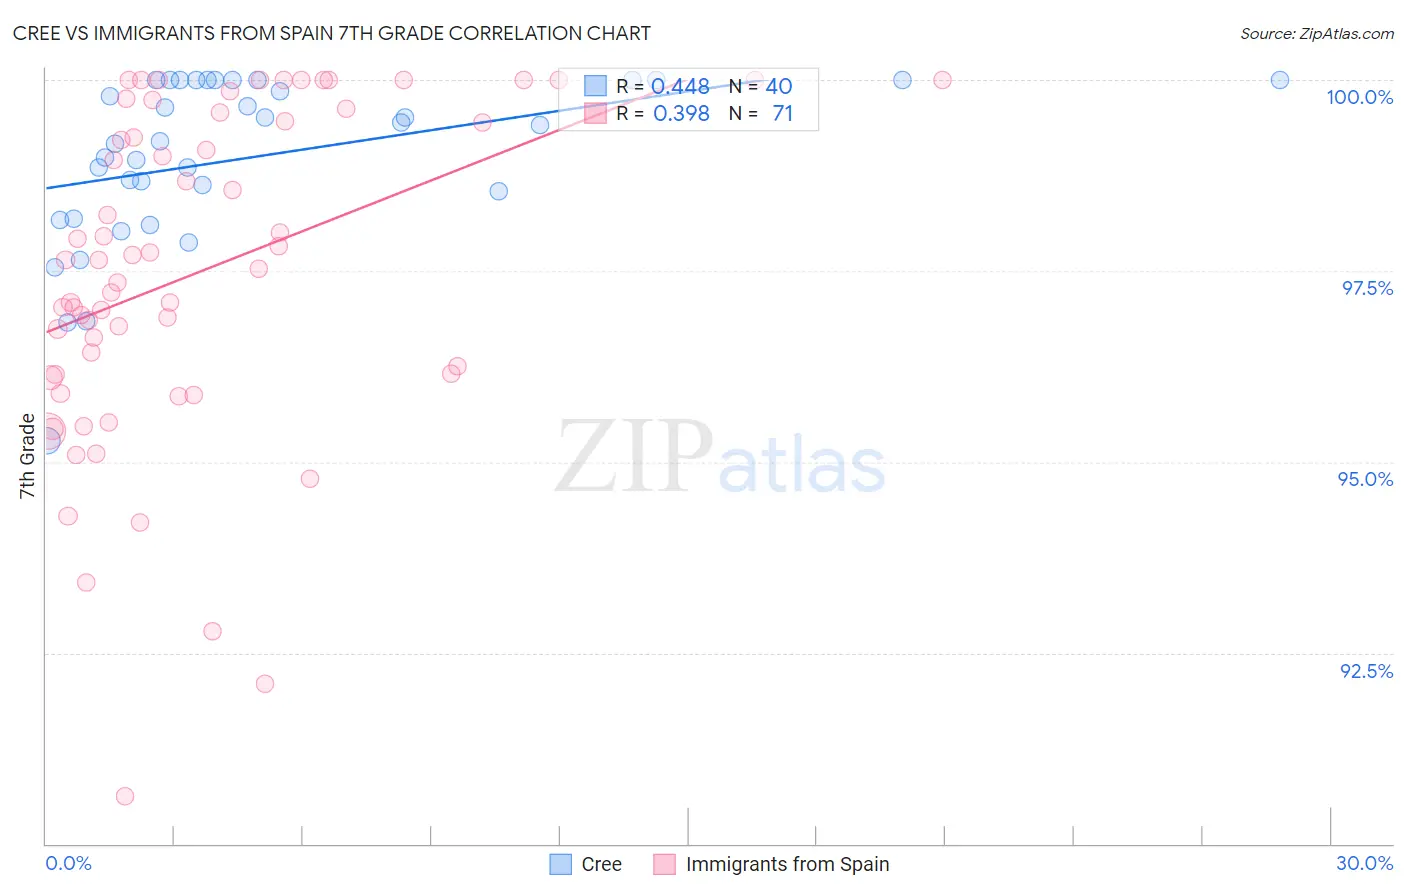
Cree vs Immigrants from Spain 7th Grade Correlation Chart
The statistical analysis conducted on geographies consisting of 76,204,399 people shows a moderate positive correlation between the proportion of Cree and percentage of population with at least 7th grade education in the United States with a correlation coefficient (R) of 0.448 and weighted average of 96.7%. Similarly, the statistical analysis conducted on geographies consisting of 239,679,924 people shows a mild positive correlation between the proportion of Immigrants from Spain and percentage of population with at least 7th grade education in the United States with a correlation coefficient (R) of 0.398 and weighted average of 96.0%, a difference of 0.77%.
7th Grade Correlation Summary
| Measurement | Cree | Immigrants from Spain |
| Minimum | 95.3% | 90.6% |
| Maximum | 100.0% | 100.0% |
| Range | 4.7% | 9.4% |
| Mean | 99.0% | 97.5% |
| Median | 99.3% | 97.6% |
| Interquartile 25% (IQ1) | 98.4% | 96.1% |
| Interquartile 75% (IQ3) | 100.0% | 99.6% |
| Interquartile Range (IQR) | 1.6% | 3.4% |
| Standard Deviation (Sample) | 1.1% | 2.1% |
| Standard Deviation (Population) | 1.1% | 2.1% |
Similar Demographics by 7th Grade
Demographics Similar to Cree by 7th Grade
In terms of 7th grade, the demographic groups most similar to Cree are Immigrants from Belgium (96.7%, a difference of 0.0%), Puget Sound Salish (96.7%, a difference of 0.0%), Turkish (96.7%, a difference of 0.010%), Immigrants from South Africa (96.7%, a difference of 0.010%), and Osage (96.7%, a difference of 0.010%).
| Demographics | Rating | Rank | 7th Grade |
| Chickasaw | 99.2 /100 | #82 | Exceptional 96.7% |
| Icelanders | 99.1 /100 | #83 | Exceptional 96.7% |
| Romanians | 99.1 /100 | #84 | Exceptional 96.7% |
| Kiowa | 99.1 /100 | #85 | Exceptional 96.7% |
| Turks | 99.1 /100 | #86 | Exceptional 96.7% |
| Immigrants | Belgium | 99.0 /100 | #87 | Exceptional 96.7% |
| Puget Sound Salish | 99.0 /100 | #88 | Exceptional 96.7% |
| Cree | 99.0 /100 | #89 | Exceptional 96.7% |
| Immigrants | South Africa | 98.9 /100 | #90 | Exceptional 96.7% |
| Osage | 98.9 /100 | #91 | Exceptional 96.7% |
| Immigrants | Western Europe | 98.9 /100 | #92 | Exceptional 96.7% |
| Potawatomi | 98.9 /100 | #93 | Exceptional 96.7% |
| Lebanese | 98.8 /100 | #94 | Exceptional 96.7% |
| Immigrants | Australia | 98.8 /100 | #95 | Exceptional 96.7% |
| Immigrants | Denmark | 98.7 /100 | #96 | Exceptional 96.7% |
Demographics Similar to Immigrants from Spain by 7th Grade
In terms of 7th grade, the demographic groups most similar to Immigrants from Spain are Sierra Leonean (96.0%, a difference of 0.010%), Brazilian (96.0%, a difference of 0.010%), Iraqi (96.0%, a difference of 0.020%), Immigrants from Iraq (96.0%, a difference of 0.020%), and Immigrants from Uganda (96.0%, a difference of 0.020%).
| Demographics | Rating | Rank | 7th Grade |
| Chileans | 49.3 /100 | #176 | Average 96.0% |
| Immigrants | Korea | 49.2 /100 | #177 | Average 96.0% |
| Marshallese | 48.4 /100 | #178 | Average 96.0% |
| Immigrants | Iran | 47.8 /100 | #179 | Average 96.0% |
| Immigrants | Brazil | 46.8 /100 | #180 | Average 96.0% |
| Pakistanis | 44.5 /100 | #181 | Average 96.0% |
| Iraqis | 41.2 /100 | #182 | Average 96.0% |
| Immigrants | Spain | 38.8 /100 | #183 | Fair 96.0% |
| Sierra Leoneans | 37.5 /100 | #184 | Fair 96.0% |
| Brazilians | 37.3 /100 | #185 | Fair 96.0% |
| Immigrants | Iraq | 36.1 /100 | #186 | Fair 96.0% |
| Immigrants | Uganda | 36.0 /100 | #187 | Fair 96.0% |
| Immigrants | Egypt | 34.3 /100 | #188 | Fair 95.9% |
| Immigrants | Venezuela | 33.9 /100 | #189 | Fair 95.9% |
| Immigrants | Micronesia | 32.6 /100 | #190 | Fair 95.9% |